Interpretation
The analysis of this survey is far from complete. Here's what needs to be done (add more if you like):
- Add interpretive analyses
- Output more correlation analyses upon request
Keep in mind that until most of the above is complete, the survey results should be used with caution, upon closer inspection, some of the data may change slightly.
If you do use the data, please share how it was used by adding to the 'Applications - Use History' section.
Modifications
Currency Exchange
All prices are in Canadian/US currency, since the average exchange rate between CAD and USD in 2010 was only about 3 cents off and most of the prices entered were estimations, I did not modify the data for either American nor Canadian entries in this regard. The single UK respondent's prices were converted using an approximation of the years exchange rate between USD and GBP which was 0.647558.
Duplicate Entries
There were up to three entries per shop in some cases. For any of these, multiple choice questions were updated to be the union of the two entries while numeric entries were calculated as averages. When a choice had to be made, the answers from the more complete entry took priority.
Flaws
There's at least a few, feel free to add. Just some food for thought in case we decide to do this again in the future.
Sample Size
This same size was not extremely small, 49 collectives contributed in total, but it is small enough that when broken down into smaller subsets the size becomes problematic. For example, when comparing results between US and Canadian collectives, the Canadian subset contains only 15 respondents, thus it is hard to really tell the difference between arbitrary fluctuations and true trends.
Mandatory Personal Questions
Some questions, notable total income, were left as compulsory. In this case in particular this left some respondents to enter 0 if they did not feel comfortable submitting this information. In the end, cases of zero for total income were left as 0 and not set to unanswered since it was impossible to tell if the respondent's organization actually made no income or if the information was simply not shared. In any case, there were very few so the average was not thrown off too much.
Ambiguous Questions
Some questions turned out to be more ambiguous or otherwise unclear than expected, for example the question regarding ownership of space. There were more respondents than expected that answered positively to this question. Ownership of space should have been clearly defined as having complete ownership of, and have no amount owing on a mortgage.
Applications
Suggested Use
- Building a Business Plan
- Identifying if your collective falls outside of the trends shown (so how you can make changes for yourself or suggest to others they can become a better organization).
Use History
Please add you experience to this section, let others know how they have helped you by contributing.
Results
Basic Organization Information
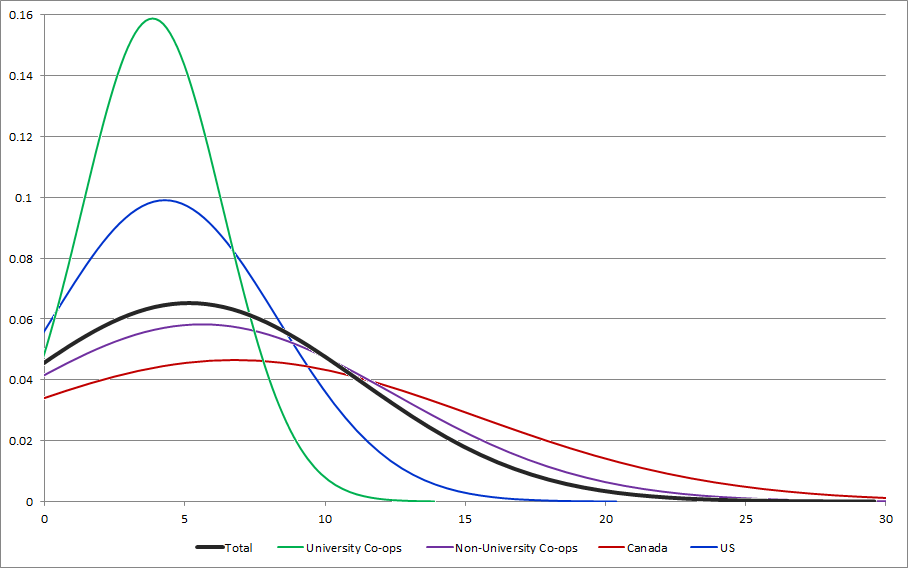
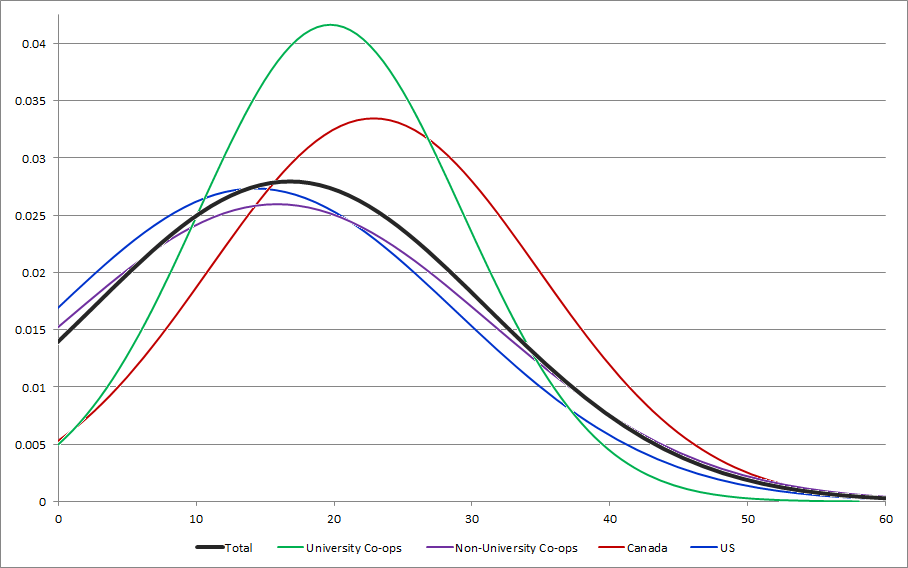
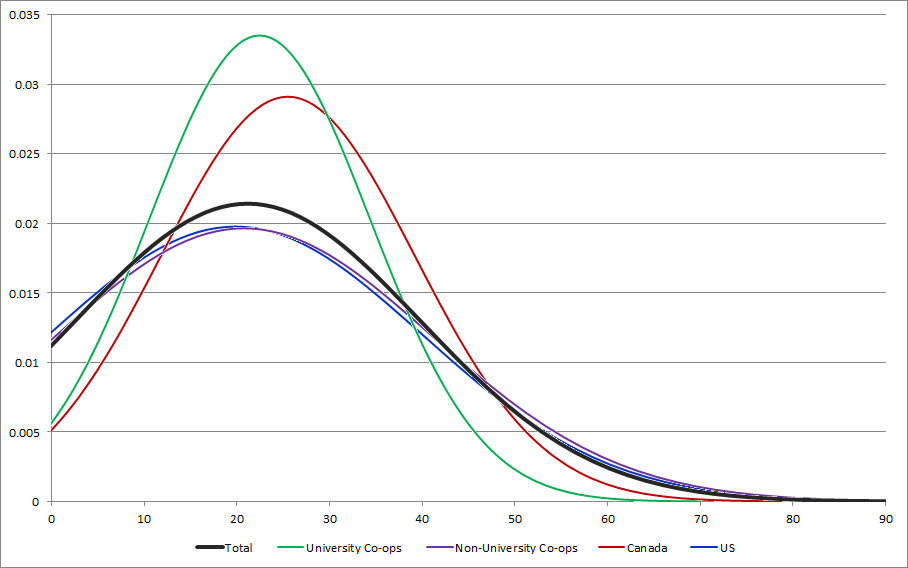
Year of Establishment
|
|
Total
|
University Co-ops
|
Non-University Co-ops
|
Canada
|
US
|
| 1980
|
1
|
0
|
1
|
1
|
0
|
| 1987
|
1
|
0
|
1
|
0
|
1
|
| 1990
|
1
|
0
|
1
|
0
|
1
|
| 1991
|
0
|
0
|
0
|
0
|
0
|
| 1992
|
0
|
0
|
0
|
0
|
0
|
| 1993
|
1
|
0
|
1
|
1
|
0
|
| 1994
|
0
|
0
|
0
|
0
|
0
|
| 1995
|
0
|
0
|
0
|
0
|
0
|
| 1996
|
0
|
0
|
0
|
0
|
0
|
| 1997
|
1
|
0
|
1
|
0
|
1
|
| 1998
|
0
|
0
|
0
|
0
|
0
|
| 1999
|
0
|
0
|
0
|
0
|
0
|
| 2000
|
1
|
0
|
1
|
0
|
1
|
| 2001
|
2
|
1
|
1
|
1
|
1
|
| 2002
|
0
|
0
|
0
|
0
|
0
|
| 2003
|
1
|
1
|
0
|
1
|
0
|
| 2004
|
2
|
1
|
1
|
0
|
2
|
| 2005
|
6
|
2
|
4
|
2
|
4
|
| 2006
|
7
|
1
|
6
|
2
|
5
|
| 2007
|
9
|
3
|
6
|
1
|
8
|
| 2008
|
6
|
2
|
4
|
3
|
3
|
| 2009
|
5
|
1
|
4
|
2
|
3
|
| 2010
|
5
|
1
|
4
|
1
|
3
|
| Shop Age
|
|
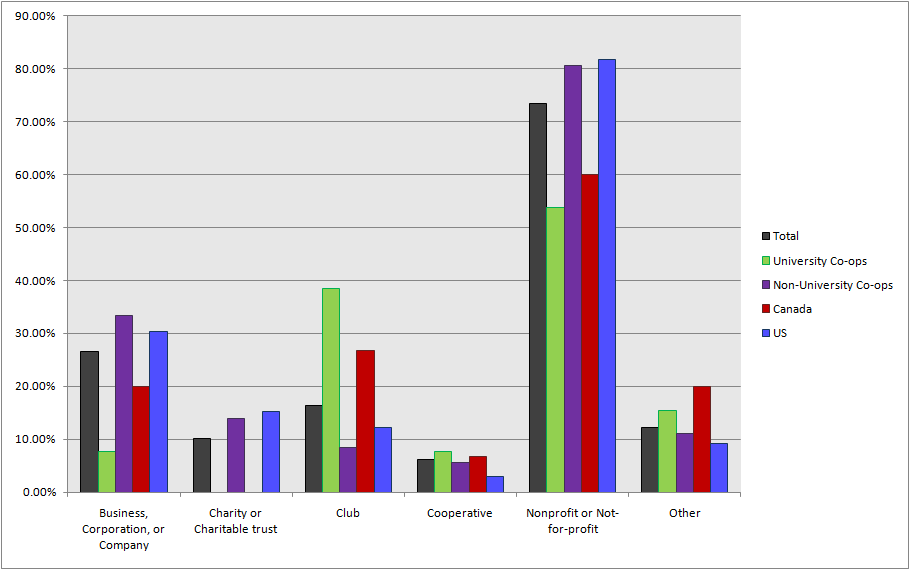
In 2010, which of the following was your organization or collective formally recognized as?
|
|
Total
|
University Co-ops
|
Non-University Co-ops
|
Canada
|
US
|
| Business, Corporation, or Company
|
13
|
1
|
12
|
3
|
10
|
| Charity or Charitable trust
|
5
|
0
|
5
|
0
|
5
|
| Club
|
8
|
5
|
3
|
4
|
4
|
| Cooperative
|
3
|
1
|
2
|
1
|
1
|
| Nonprofit or Not-for-profit
|
36
|
7
|
29
|
9
|
27
|
| Other
|
6
|
2
|
4
|
3
|
3
|
| Totals
|
|
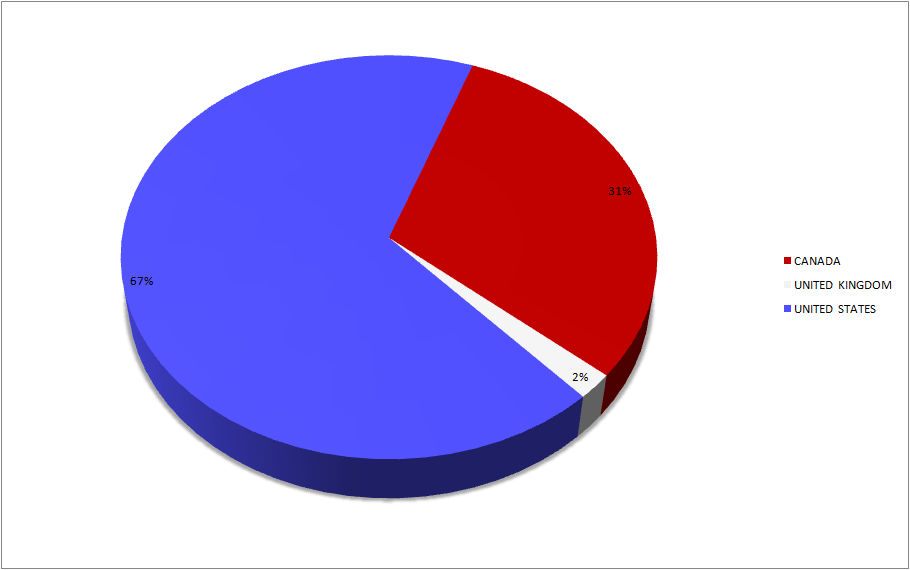
Country
|
|
Total
|
University Co-ops
|
Non-University Co-ops
|
| CANADA
|
15
|
7
|
8
|
| UNITED KINGDOM
|
1
|
0
|
1
|
| UNITED STATES
|
33
|
6
|
27
|
| Totals
|
|
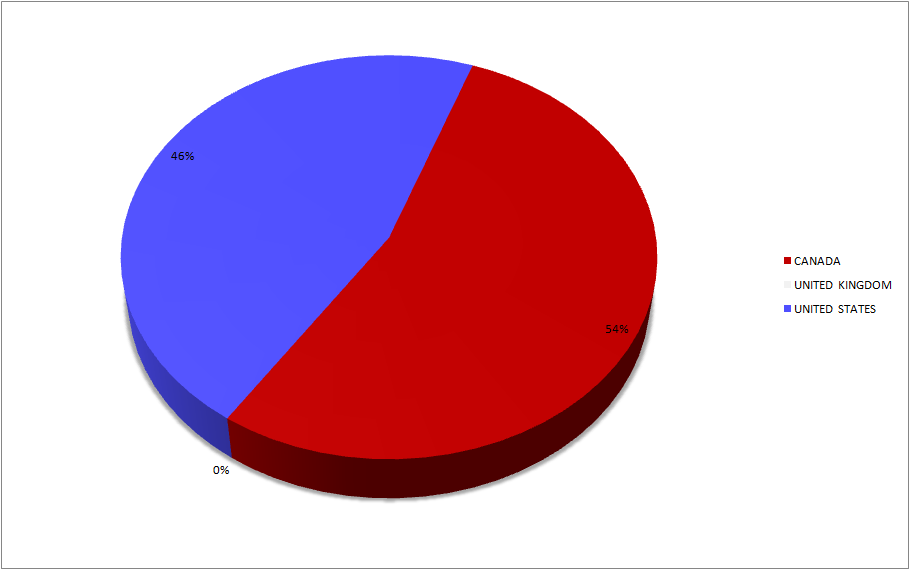
| University and Colleges:
|
|
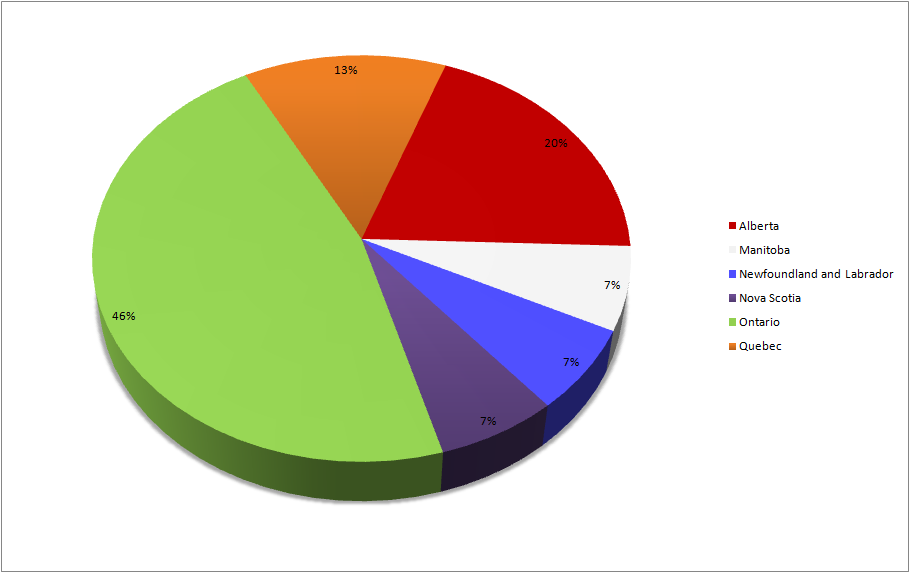
Province
|
|
Total
|
University Co-ops
|
Non-University Co-ops
|
| Alberta
|
3
|
1
|
2
|
| Manitoba
|
1
|
0
|
1
|
| Newfoundland and Labrador
|
1
|
0
|
1
|
| Nova Scotia
|
1
|
1
|
0
|
| Ontario
|
7
|
3
|
4
|
| Quebec
|
2
|
2
|
0
|
| Totals
|
|
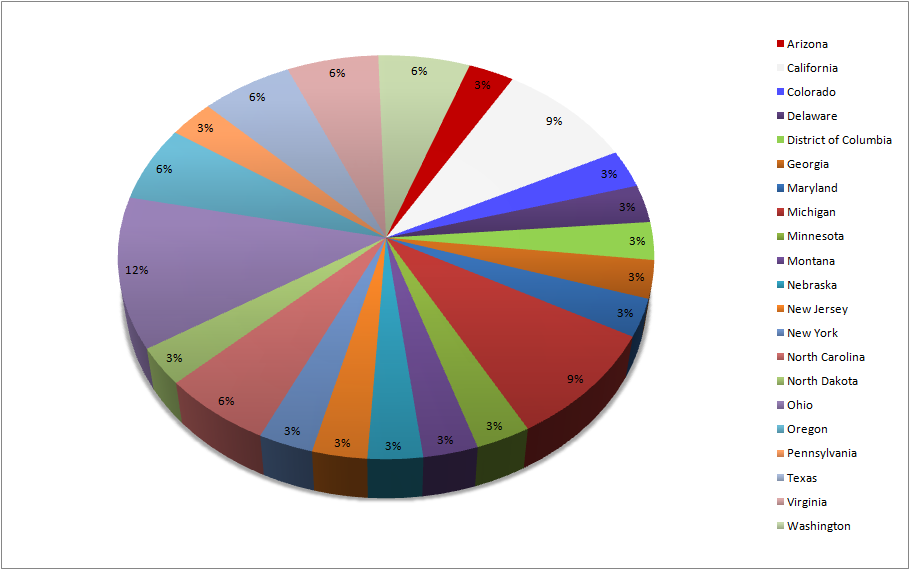
State
|
|
Total
|
University Co-ops
|
Non-University Co-ops
|
| Arizona
|
1
|
1
|
0
|
| California
|
3
|
1
|
2
|
| Colorado
|
1
|
1
|
0
|
| Delaware
|
1
|
0
|
1
|
| District of Columbia
|
1
|
0
|
1
|
| Georgia
|
1
|
0
|
1
|
| Maryland
|
1
|
0
|
1
|
| Michigan
|
3
|
1
|
2
|
| Minnesota
|
1
|
0
|
1
|
| Montana
|
1
|
0
|
1
|
| Nebraska
|
1
|
0
|
1
|
| New Jersey
|
1
|
0
|
1
|
| New York
|
1
|
0
|
1
|
| North Carolina
|
2
|
0
|
2
|
| North Dakota
|
1
|
0
|
1
|
| Ohio
|
4
|
0
|
4
|
| Oregon
|
2
|
0
|
2
|
| Pennsylvania
|
1
|
0
|
1
|
| Texas
|
2
|
2
|
0
|
| Virginia
|
2
|
0
|
2
|
| Washington
|
2
|
0
|
2
|
| Totals
|
|
City
The results of this question will not be directly shown here but a request can be made for correlations between city specific information. For example a request may be made to show the correlation between the city's poverty rate and the usage rate of shops.
Population
|
|
Total
|
University Co-ops
|
Non-University Co-ops
|
Canada
|
US
|
| 5 000 - 10 000
|
2
|
0
|
2
|
0
|
2
|
| 10 000 - 50 000
|
4
|
2
|
2
|
0
|
4
|
| 50 000 - 100 000
|
7
|
2
|
5
|
1
|
6
|
| 100 000 - 500 000
|
16
|
3
|
13
|
4
|
12
|
| 500 000 - 1 000 000
|
11
|
2
|
9
|
3
|
7
|
| 1 000 000 - 5 000 000
|
7
|
4
|
3
|
6
|
1
|
| 5 000 000 - 10 000 000
|
2
|
0
|
2
|
1
|
1
|
| Distribution
|
|
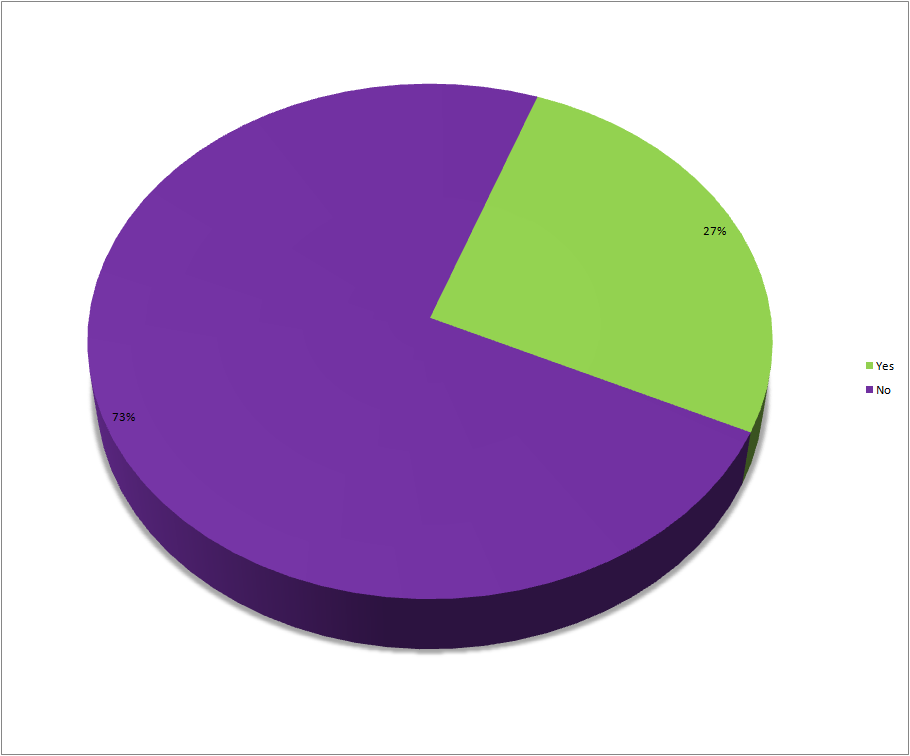
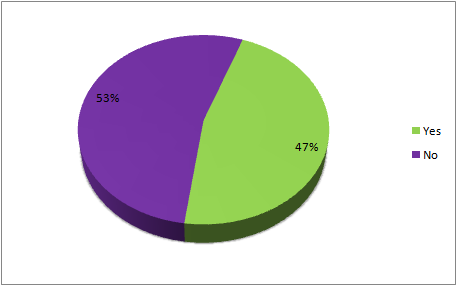
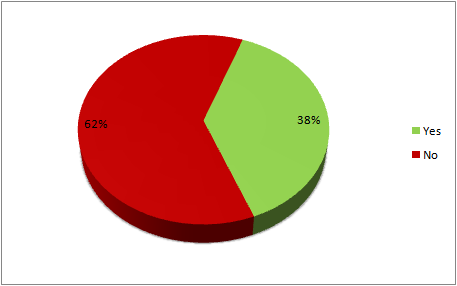
Is your collective / organization associated in any way with a university or college?
|
|
Total
|
Canada
|
US
|
| Yes
|
13
|
7
|
6
|
| No
|
36
|
8
|
27
|
| Totals
|
|
| Canada
|
US
|
|

|
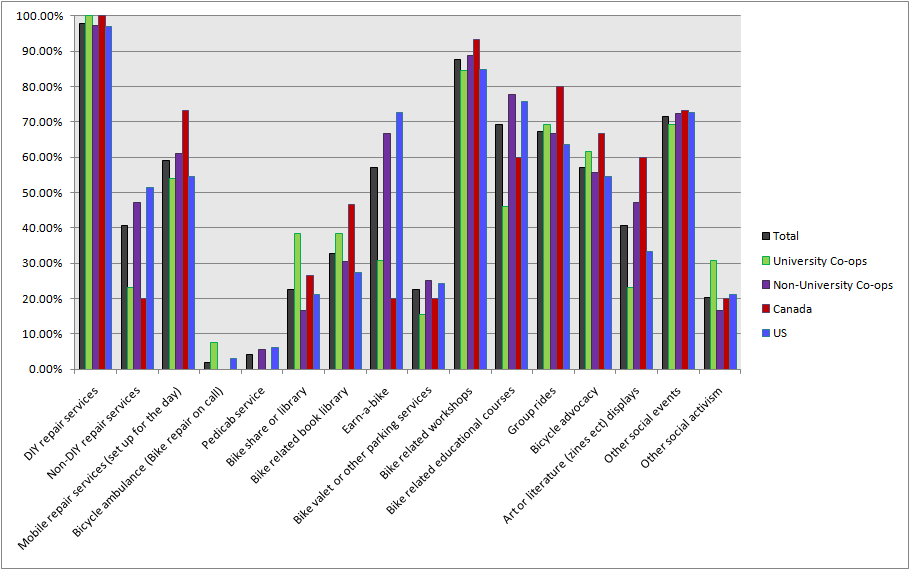
Services Offered
Services
DIY repair services
|
|
Total
|
University Co-ops
|
Non-University Co-ops
|
Canada
|
US
|
| YES
|
48
|
13
|
35
|
15
|
32
|
Non-DIY repair services
|
|
Total
|
University Co-ops
|
Non-University Co-ops
|
Canada
|
US
|
| YES
|
20
|
3
|
17
|
3
|
17
|
Mobile repair services (set up for the day)
|
|
Total
|
University Co-ops
|
Non-University Co-ops
|
Canada
|
US
|
| YES
|
29
|
7
|
22
|
11
|
18
|
| Used to
|
2
|
0
|
2
|
1
|
1
|
| Want / Trying / Going to
|
6
|
2
|
4
|
1
|
5
|
Bicycle ambulance (Bike repair on call)
|
|
Total
|
University Co-ops
|
Non-University Co-ops
|
Canada
|
US
|
| YES
|
1
|
1
|
0
|
0
|
1
|
| Used to
|
1
|
0
|
1
|
0
|
1
|
| Want / Trying / Going to
|
1
|
1
|
0
|
1
|
0
|
Pedicab service
|
|
Total
|
University Co-ops
|
Non-University Co-ops
|
Canada
|
US
|
| YES
|
2
|
0
|
2
|
0
|
2
|
| Used to
|
1
|
0
|
1
|
0
|
1
|
| Want / Trying / Going to
|
3
|
0
|
3
|
0
|
3
|
Bike share or library
|
|
Total
|
University Co-ops
|
Non-University Co-ops
|
Canada
|
US
|
| YES
|
11
|
5
|
6
|
4
|
7
|
| Used to
|
1
|
1
|
0
|
0
|
1
|
| Want / Trying / Going to
|
7
|
4
|
3
|
3
|
4
|
Bike related book library
|
|
Total
|
University Co-ops
|
Non-University Co-ops
|
Canada
|
US
|
| YES
|
16
|
5
|
11
|
7
|
9
|
| Used to
|
1
|
0
|
1
|
1
|
0
|
| Want / Trying / Going to
|
6
|
1
|
5
|
1
|
5
|
Earn-a-bike
|
|
Total
|
University Co-ops
|
Non-University Co-ops
|
Canada
|
US
|
| YES
|
28
|
4
|
24
|
3
|
24
|
| Used to
|
2
|
1
|
1
|
0
|
2
|
| Want / Trying / Going to
|
5
|
2
|
3
|
2
|
3
|
Bike valet or other parking services
|
|
Total
|
University Co-ops
|
Non-University Co-ops
|
Canada
|
US
|
| YES
|
11
|
2
|
9
|
3
|
8
|
| Used to
|
1
|
0
|
1
|
0
|
1
|
| Want / Trying / Going to
|
9
|
3
|
6
|
3
|
6
|
Bike related workshops
|
|
Total
|
University Co-ops
|
Non-University Co-ops
|
Canada
|
US
|
| YES
|
43
|
11
|
32
|
14
|
28
|
| Want / Trying / Going to
|
3
|
0
|
3
|
0
|
3
|
Bike related educational courses
|
|
Total
|
University Co-ops
|
Non-University Co-ops
|
Canada
|
US
|
| YES
|
34
|
6
|
28
|
9
|
25
|
| Used to
|
1
|
1
|
0
|
0
|
1
|
| Want / Trying / Going to
|
7
|
2
|
5
|
3
|
4
|
Group rides
|
|
Total
|
University Co-ops
|
Non-University Co-ops
|
Canada
|
US
|
| YES
|
33
|
9
|
24
|
12
|
21
|
| Used to
|
2
|
1
|
1
|
1
|
1
|
| Want / Trying / Going to
|
6
|
2
|
4
|
0
|
5
|
Bicycle advocacy
|
|
Total
|
University Co-ops
|
Non-University Co-ops
|
Canada
|
US
|
| YES
|
28
|
8
|
20
|
10
|
18
|
| Used to
|
1
|
0
|
1
|
0
|
1
|
| Want / Trying / Going to
|
3
|
1
|
2
|
0
|
3
|
Art or literature (zines ect) displays
|
|
Total
|
University Co-ops
|
Non-University Co-ops
|
Canada
|
US
|
| YES
|
20
|
3
|
17
|
9
|
11
|
| Used to
|
1
|
1
|
0
|
1
|
0
|
| Want / Trying / Going to
|
9
|
4
|
5
|
2
|
7
|
Other social events
|
|
Total
|
University Co-ops
|
Non-University Co-ops
|
Canada
|
US
|
| YES
|
35
|
9
|
26
|
11
|
24
|
| Used to
|
2
|
1
|
1
|
1
|
1
|
| Want / Trying / Going to
|
2
|
0
|
2
|
0
|
2
|
Other social activism
|
|
Total
|
University Co-ops
|
Non-University Co-ops
|
Canada
|
US
|
| YES
|
10
|
4
|
6
|
3
|
7
|
| Used to
|
1
|
1
|
0
|
1
|
0
|
| Want / Trying / Going to
|
9
|
2
|
7
|
5
|
3
|
| Totals
|
|
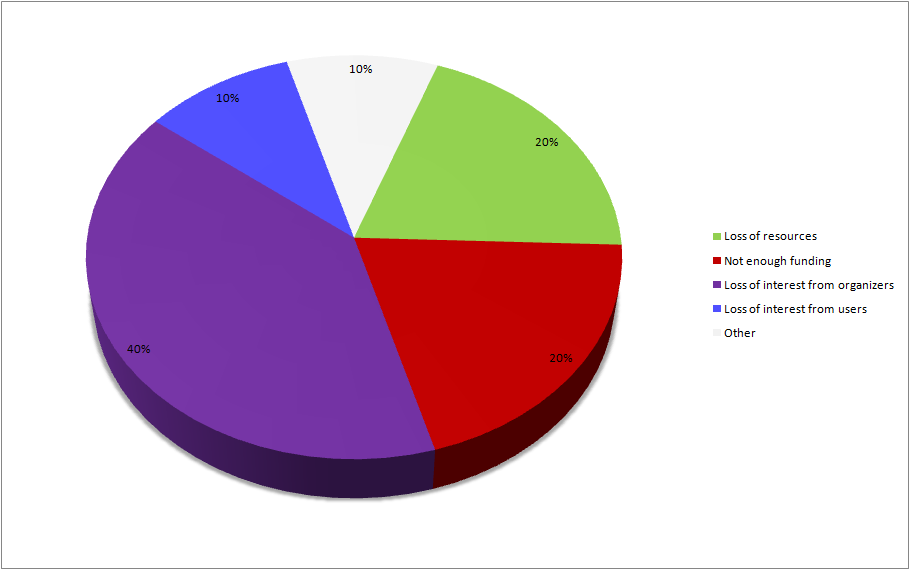
Why did you stop offering some of your services?
|
|
Total
|
University Co-ops
|
Non-University Co-ops
|
Canada
|
US
|
| Loss of resources
|
2
|
2
|
0
|
1
|
1
|
| Not enough funding
|
2
|
0
|
2
|
0
|
2
|
| Loss of interest from organizers
|
4
|
0
|
4
|
1
|
3
|
| Loss of interest from users
|
1
|
1
|
0
|
0
|
1
|
| Other
|
1
|
1
|
0
|
0
|
1
|
| Totals
|
|
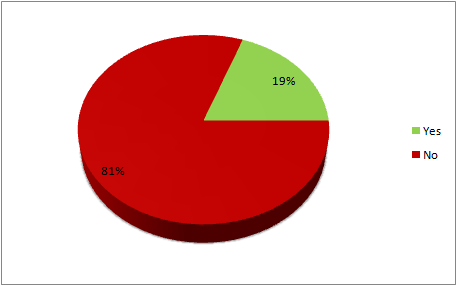
Is a membership required to use any of your services?
|
|
Total
|
University Co-ops
|
Non-University Co-ops
|
Canada
|
US
|
| Yes
|
12
|
5
|
7
|
6
|
6
|
| No
|
37
|
8
|
29
|
9
|
27
|
| Totals
|
|
| University Co-ops
|
Non-University Co-ops
|
|
|
| Canada
|
US
|
|
|
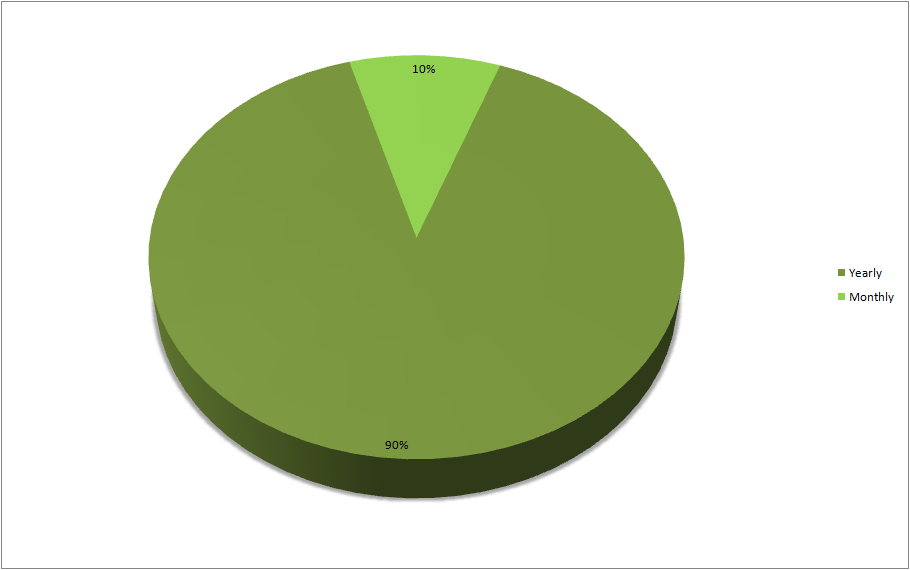
How often must a member pay for a membership in order to continue using any services?
|
|
Total
|
University Co-ops
|
Non-University Co-ops
|
Canada
|
US
|
| Yearly
|
9
|
4
|
5
|
5
|
4
|
| Monthly
|
1
|
0
|
1
|
0
|
1
|
| Other
|
2
|
1
|
1
|
1
|
1
|
| Totals
|
|
What is the cost of a membership?
|
|
Total
|
University Co-ops
|
Non-University Co-ops
|
Canada
|
US
|
| Count
|
9
|
4
|
5
|
5
|
4
|
| Sum
|
240
|
55
|
185
|
65
|
175
|
| Standard deviation
|
28.58
|
15.56
|
32.19
|
10.77
|
34.16
|
| Average
|
26.67
|
13.75
|
37
|
13
|
43.75
|
| 1st quartile
|
7.5
|
8.75
|
15
|
7.5
|
13.75
|
| 2nd quartile
|
10
|
7.5
|
20
|
5
|
32.5
|
| 3rd quartile
|
35
|
32.5
|
65
|
25
|
85
|
| Maximum
|
100
|
40
|
100
|
30
|
100
|
| Totals
|
|
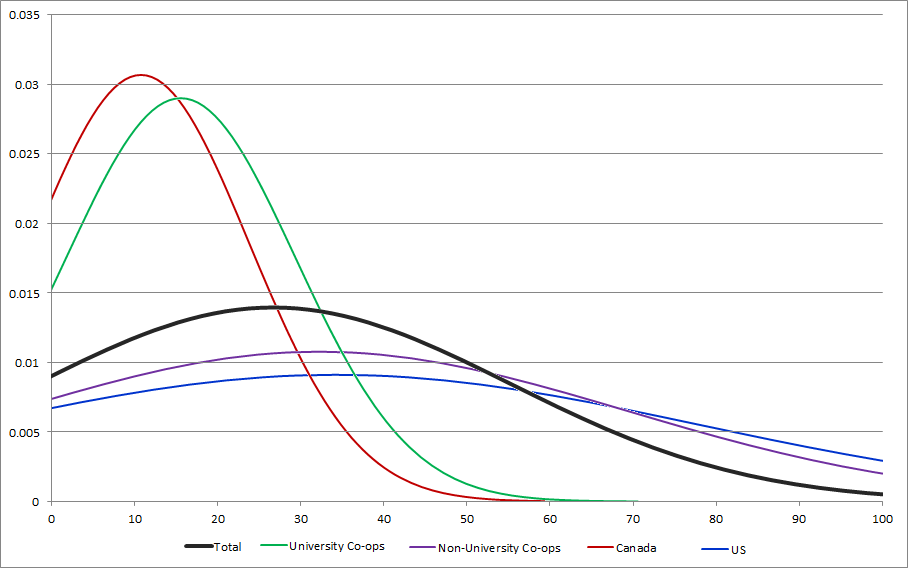
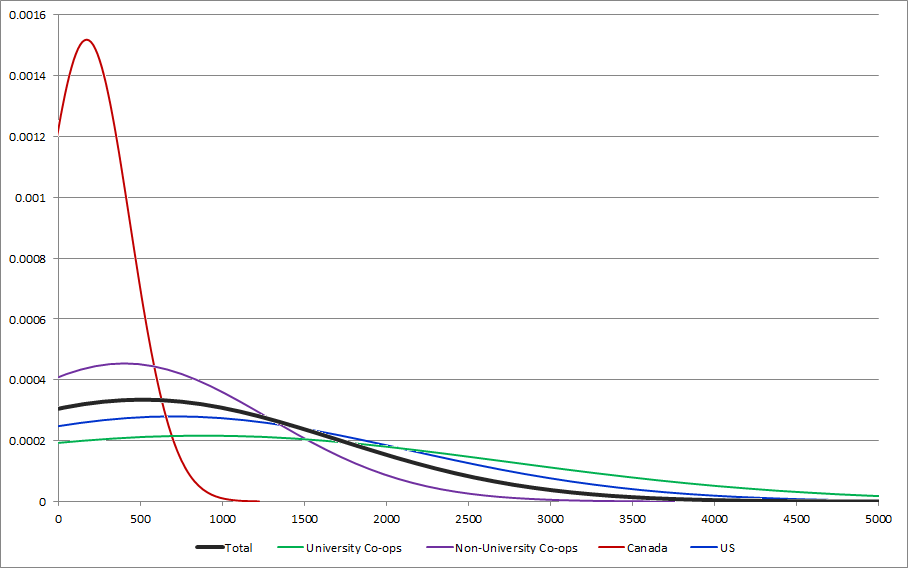
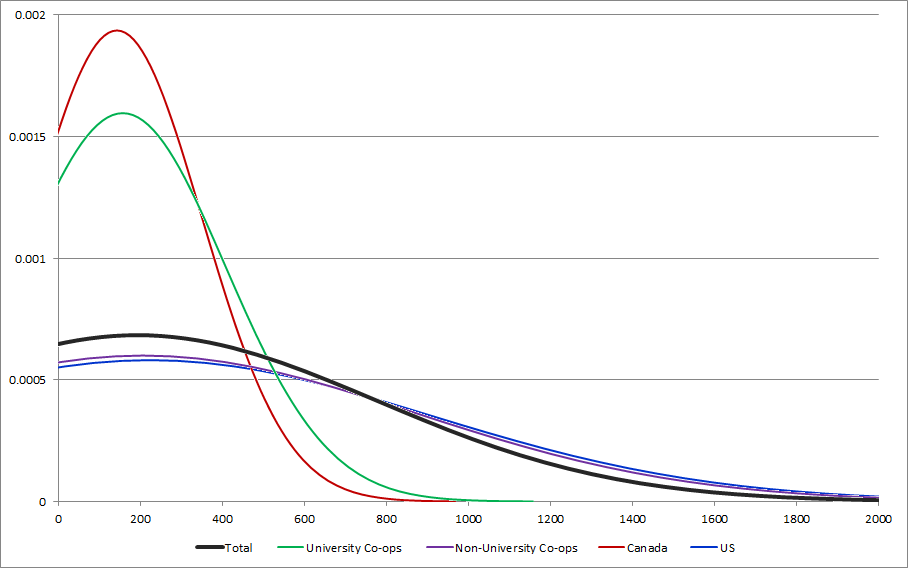
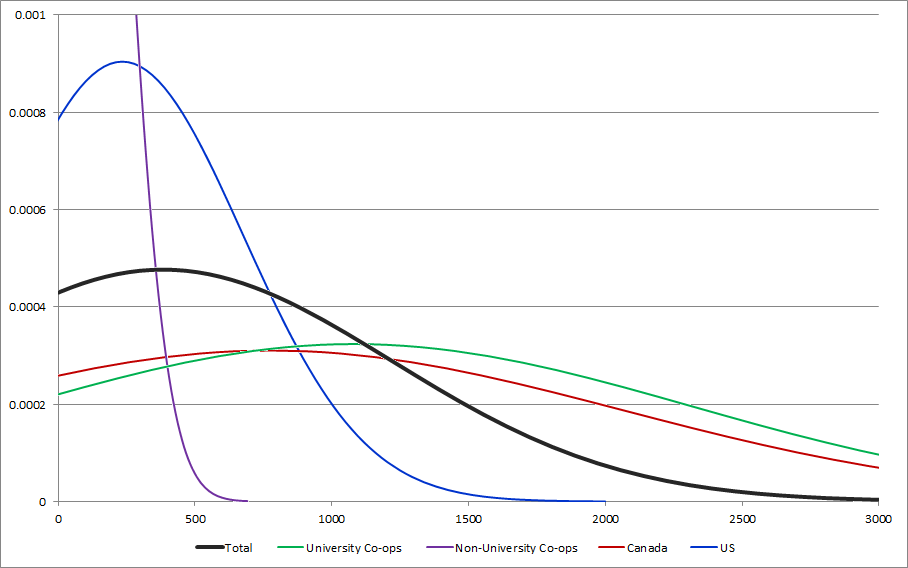
How many members joined in 2010?
|
|
Total
|
University Co-ops
|
Non-University Co-ops
|
Canada
|
US
|
| Count
|
10
|
4
|
6
|
5
|
5
|
| Sum
|
5641
|
2487
|
3154
|
4865
|
776
|
| Standard deviation
|
659.47
|
687.29
|
637.35
|
724.65
|
101.36
|
| Average
|
564.1
|
621.75
|
525.67
|
973
|
155.2
|
| Minimum
|
41
|
70
|
41
|
290
|
41
|
| 1st quartile
|
122.5
|
125.5
|
115.25
|
291
|
55.5
|
| 2nd quartile
|
291
|
308.5
|
245
|
292
|
70
|
| 3rd quartile
|
887.25
|
1431.25
|
912.25
|
1850
|
262.5
|
| Maximum
|
1900
|
1800
|
1900
|
1900
|
325
|
| Totals
|
|
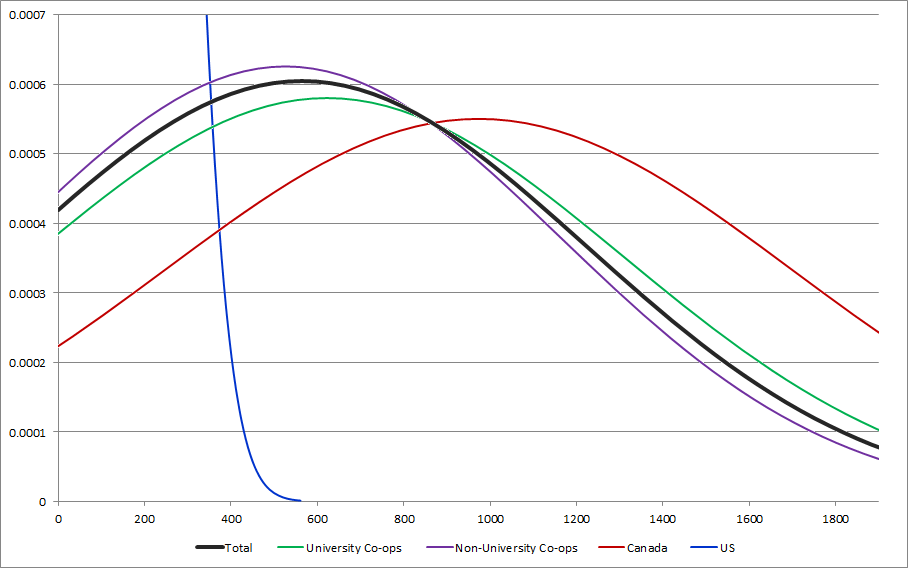
As of Dec 31st, 2010, how many members in total did you have?
|
|
Total
|
University Co-ops
|
Non-University Co-ops
|
Canada
|
US
|
| Count
|
10
|
4
|
6
|
5
|
5
|
| Sum
|
7798
|
2467
|
5331
|
6875
|
923
|
| Standard deviation
|
1114.66
|
691.35
|
1312.48
|
1327.56
|
118.36
|
| Average
|
779.8
|
616.75
|
888.5
|
1375
|
184.6
|
| Minimum
|
48
|
50
|
48
|
292
|
48
|
| 1st quartile
|
162.5
|
110.5
|
162
|
346
|
49
|
| 2nd quartile
|
312.5
|
308.5
|
350
|
400
|
50
|
| 3rd quartile
|
887.25
|
1431.25
|
1387.25
|
2800
|
312.5
|
| Maximum
|
3800
|
1800
|
3800
|
3800
|
325
|
| Totals
|
|
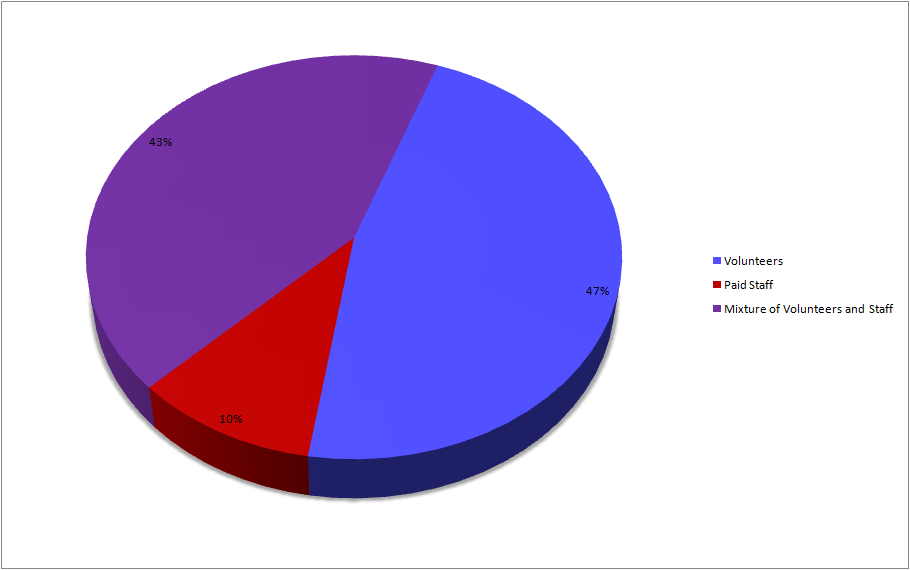
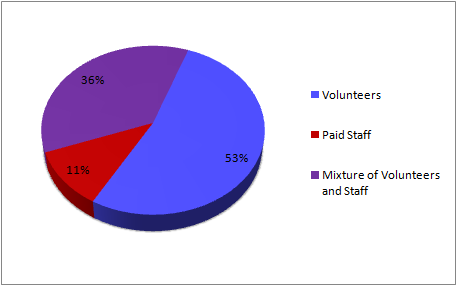
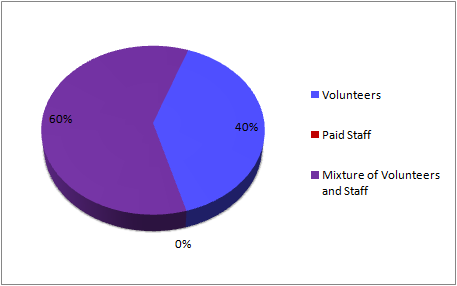
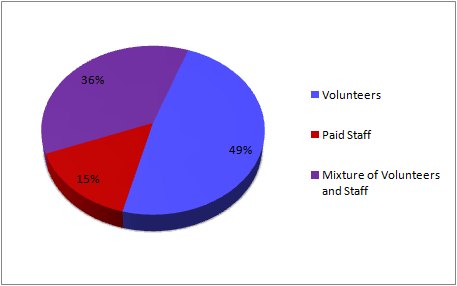
Who runs your organization?
|
|
Total
|
University Co-ops
|
Non-University Co-ops
|
Canada
|
US
|
| Volunteers
|
23
|
4
|
19
|
6
|
16
|
| Paid Staff
|
5
|
1
|
4
|
0
|
5
|
| Mixture of Volunteers and Staff
|
21
|
8
|
13
|
9
|
12
|
| Totals
|
|
| University Co-ops
|
Non-University Co-ops
|

|
|
| Canada
|
US
|
|
|
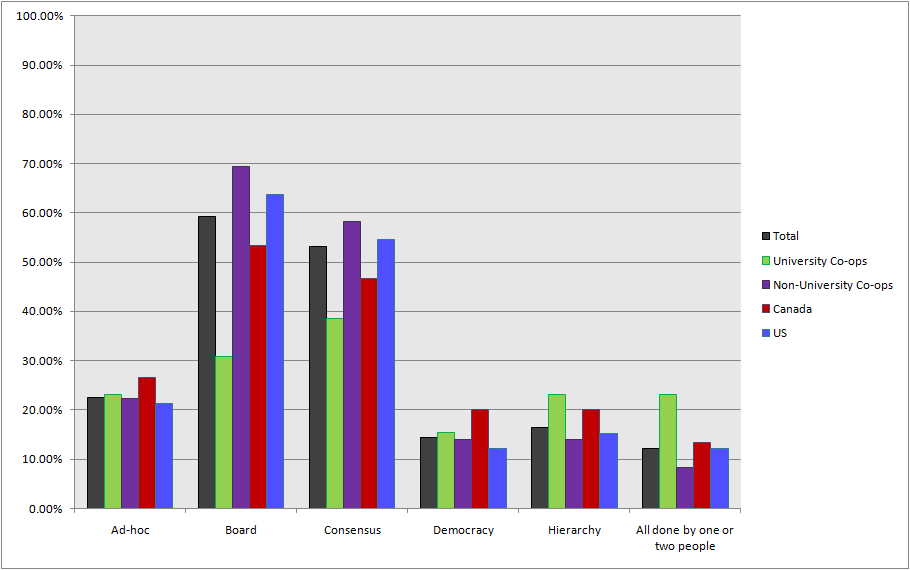
How does your organization run?
|
|
Total
|
University Co-ops
|
Non-University Co-ops
|
Canada
|
US
|
| Ad-hoc
|
11
|
3
|
8
|
4
|
7
|
| Board
|
29
|
4
|
25
|
8
|
21
|
| Consensus
|
26
|
5
|
21
|
7
|
18
|
| Democracy
|
7
|
2
|
5
|
3
|
4
|
| Hierarchy
|
8
|
3
|
5
|
3
|
5
|
| All done by one or two people
|
6
|
3
|
3
|
2
|
4
|
| Other
|
6
|
2
|
4
|
2
|
4
|
| Totals
|
|
Shop Space
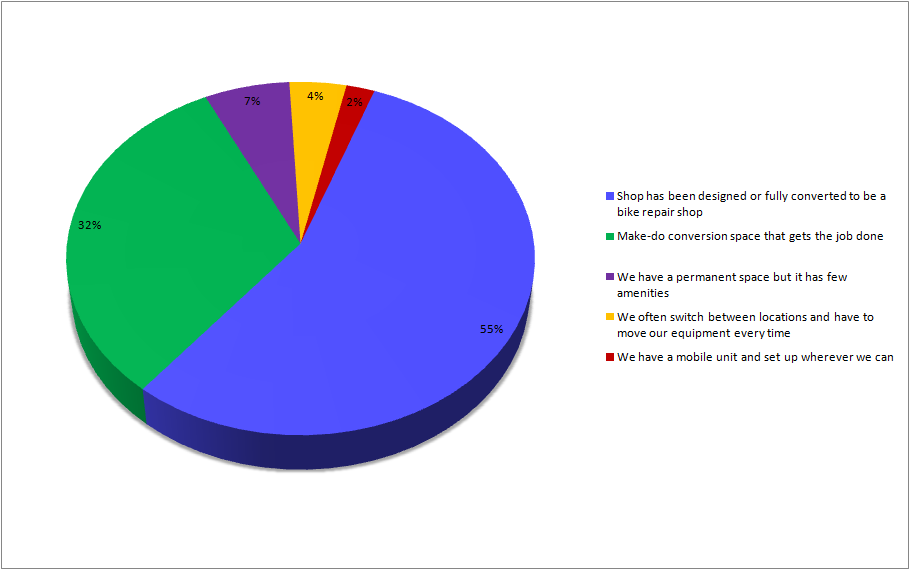
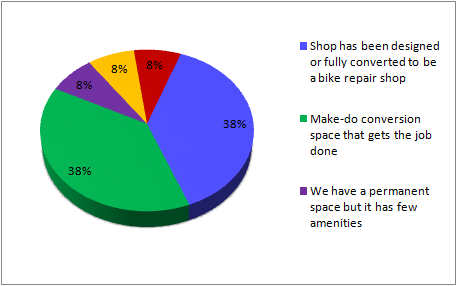
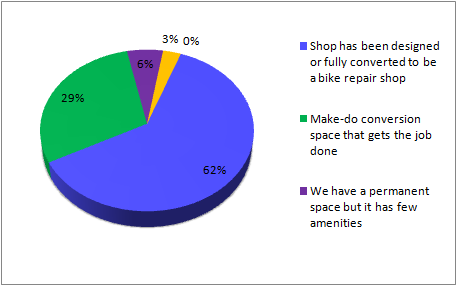
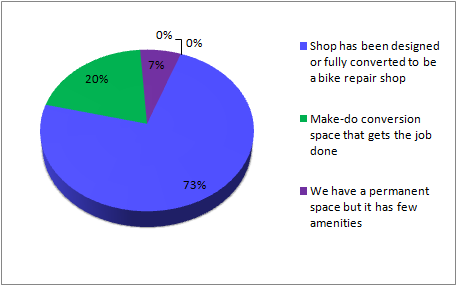
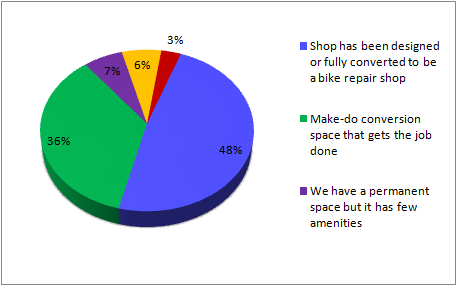
Which of the following best describes your shop space?
|
|
Total
|
University Co-ops
|
Non-University Co-ops
|
Canada
|
US
|
| Shop has been designed or fully converted to be a bike repair shop
|
26
|
5
|
21
|
11
|
15
|
| Make-do conversion space that gets the job done
|
15
|
5
|
10
|
3
|
11
|
| We have a permanent space but it has few amenities
|
3
|
1
|
2
|
1
|
2
|
| We often switch between locations and have to move our equipment every time
|
2
|
1
|
1
|
0
|
2
|
| We have a mobile unit and set up wherever we can
|
1
|
1
|
0
|
0
|
1
|
| Other
|
1
|
0
|
1
|
0
|
1
|
| Totals
|
|
| University Co-ops
|
Non-University Co-ops
|
|
|
| Canada
|
US
|
|
|
Check all that apply to your shop space
|
|
Total
|
University Co-ops
|
Non-University Co-ops
|
Canada
|
US
|
| We own our space
|
5
|
5
|
0
|
4
|
1
|
|
|
10.2%
|
38.5%
|
0.0%
|
26.7%
|
3.0%
|
| We must setup and tear-down all/most of our equipment every time we open
|
2
|
2
|
0
|
0
|
2
|
|
|
4.1%
|
15.4%
|
0.0%
|
0.0%
|
6.1%
|
| We share our space
|
4
|
4
|
0
|
1
|
3
|
|
|
8.2%
|
30.1%
|
0.0%
|
6.7%
|
9.1%
|
What kind of relationship do you have with those that you share the space with?
|
|
Total
|
University Co-ops
|
Non-University Co-ops
|
Canada
|
US
|
| Sharing our space is the ideal situation for us
|
1
|
1
|
0
|
0
|
1
|
| Sharing our space causes no major problems, but we would like to have our own
|
3
|
3
|
0
|
1
|
2
|
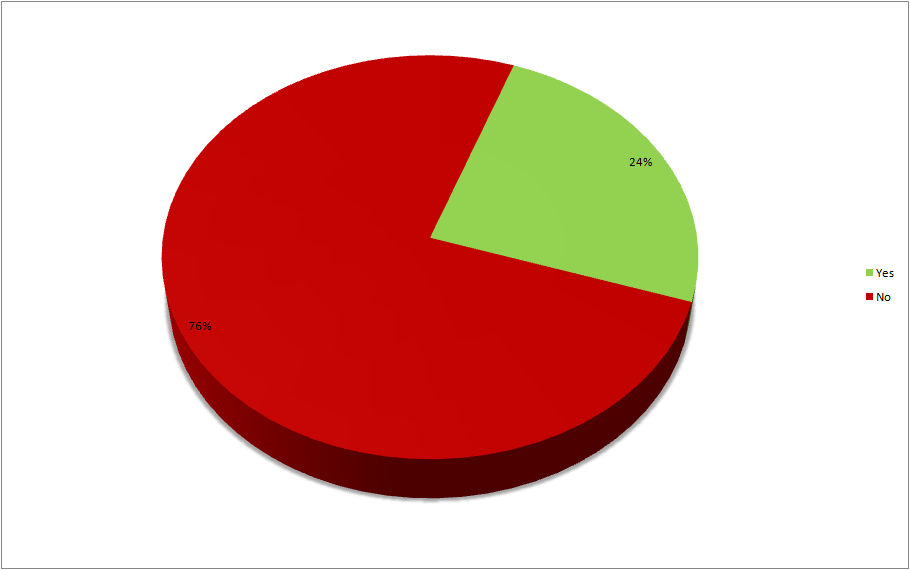
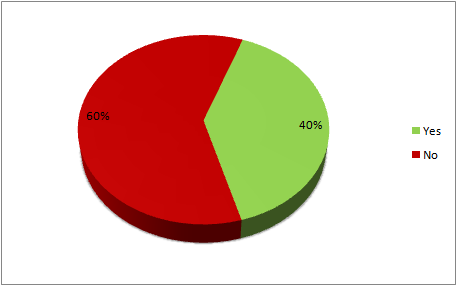
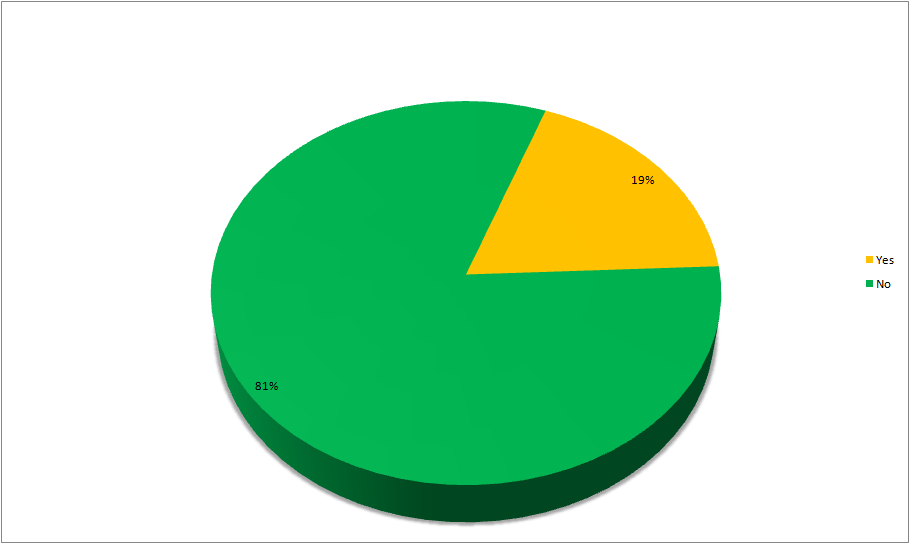
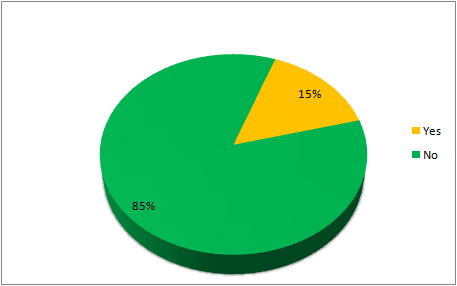
Would you say that you are lacking necessary equipment that is currently not feasible to obtain?
|
|
Total
|
University Co-ops
|
Non-University Co-ops
|
Canada
|
US
|
| Yes
|
9
|
2
|
7
|
1
|
8
|
| No
|
39
|
11
|
28
|
14
|
24
|
| Totals
|
|
| University Co-ops
|
Non-University Co-ops
|
|
|
| Canada
|
US
|
|
|
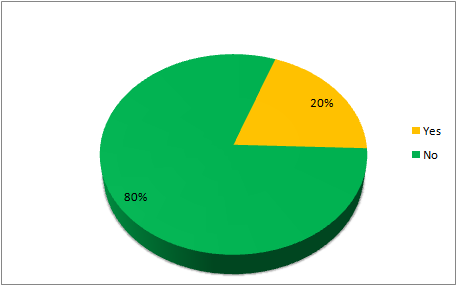
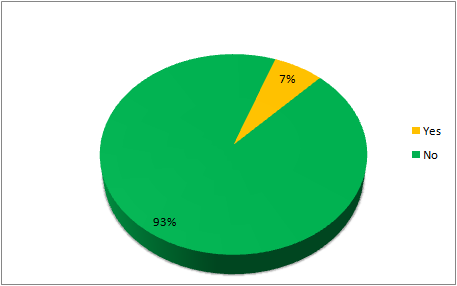
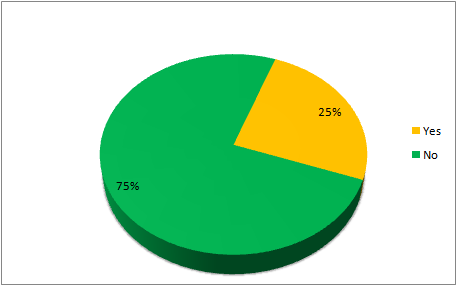
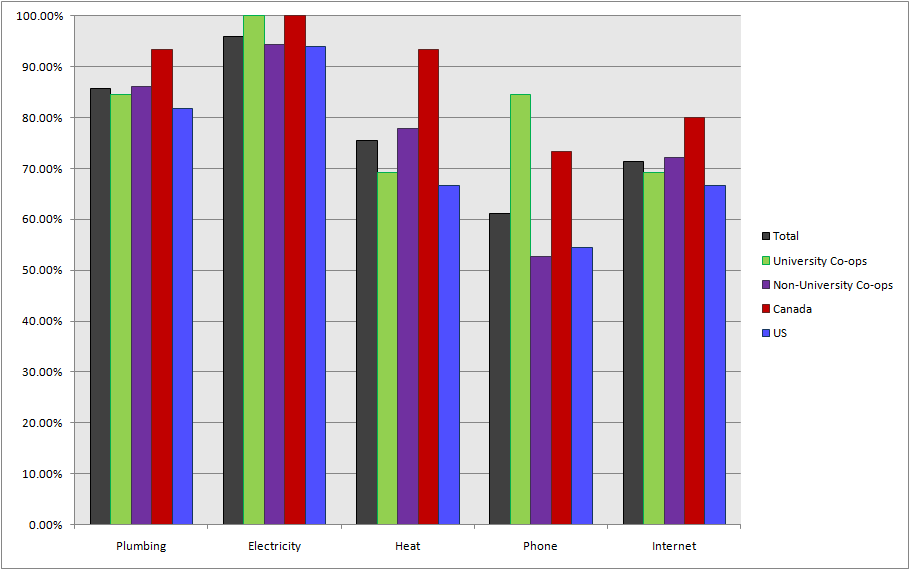
What utilities do you have on hand?
|
|
Total
|
University Co-ops
|
Non-University Co-ops
|
Canada
|
US
|
| Plumbing
|
42
|
11
|
31
|
14
|
27
|
| Electricity
|
47
|
13
|
34
|
15
|
31
|
| Heat
|
37
|
9
|
28
|
14
|
22
|
| Phone
|
30
|
11
|
19
|
11
|
18
|
| Internet
|
35
|
9
|
26
|
12
|
22
|
| Totals
|
|
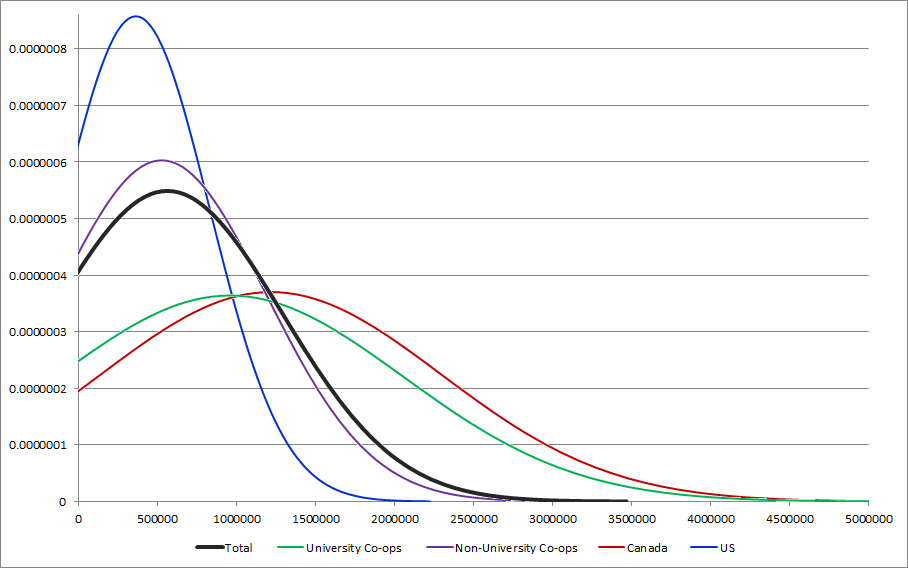
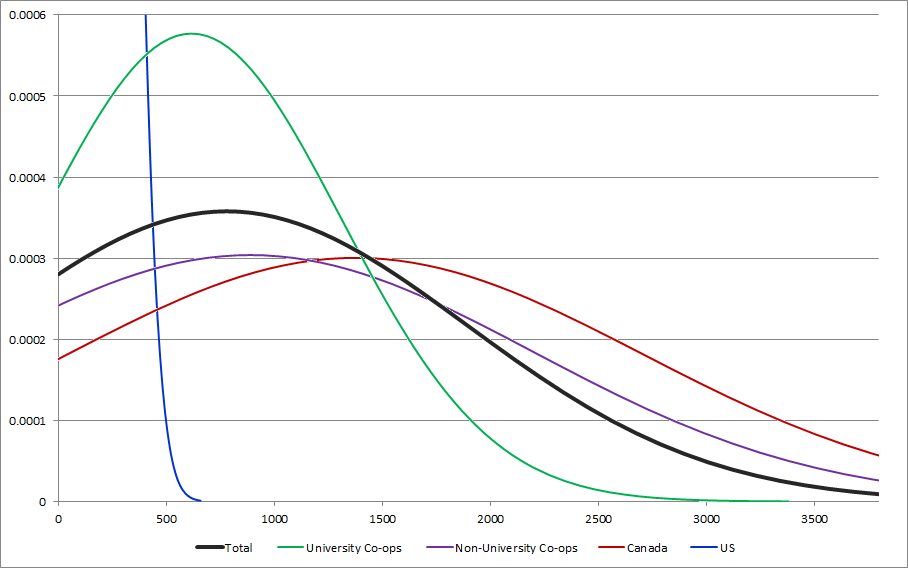
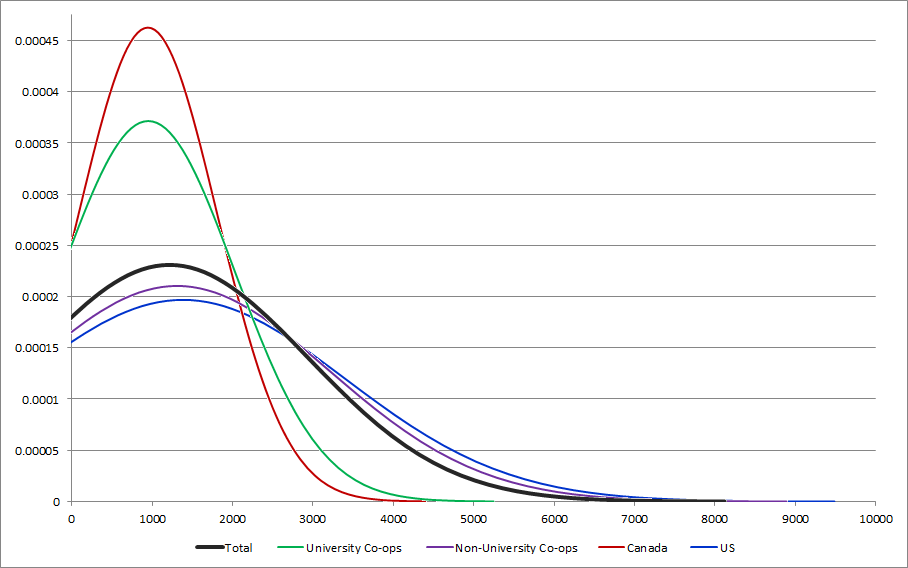
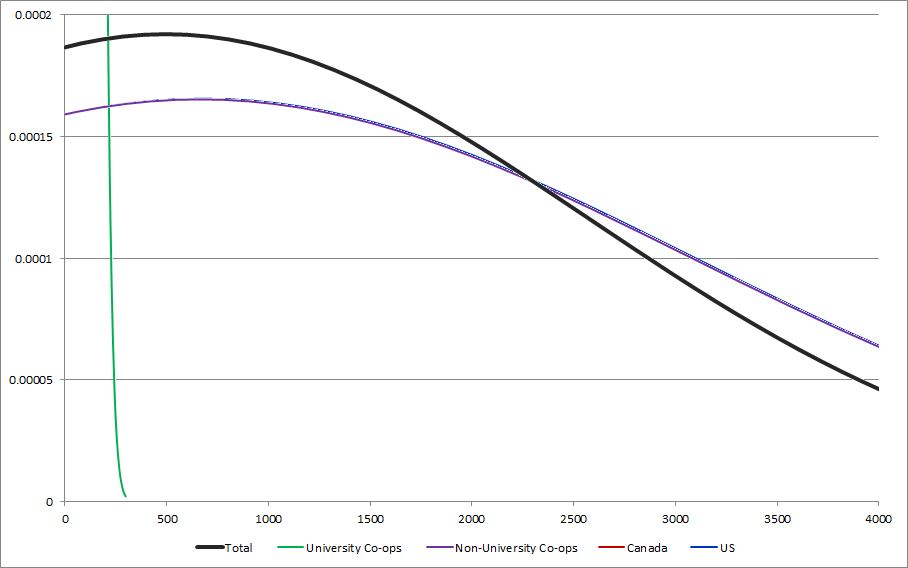
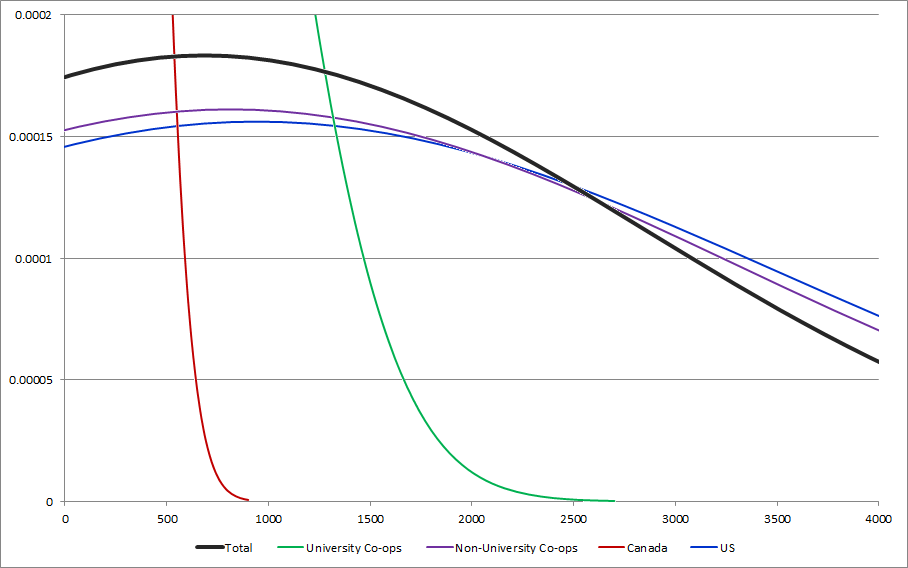
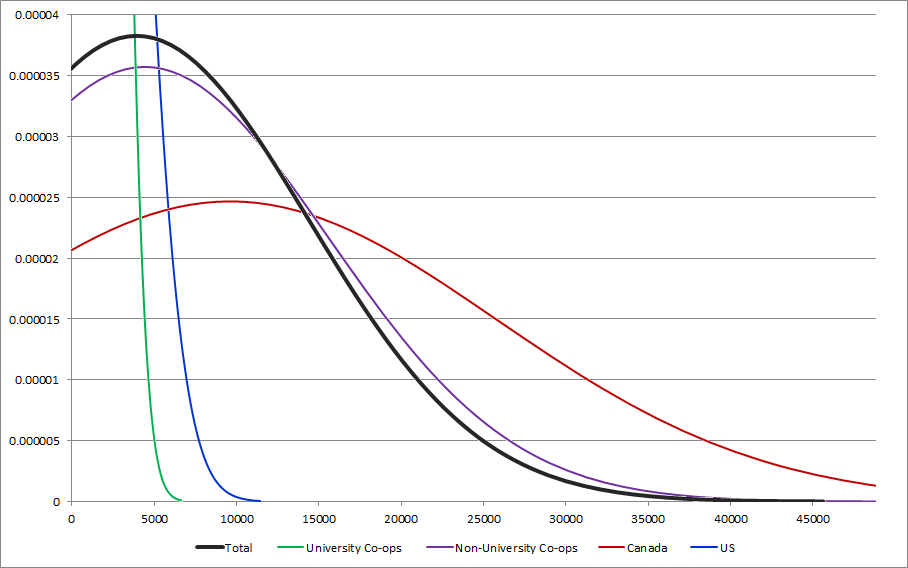
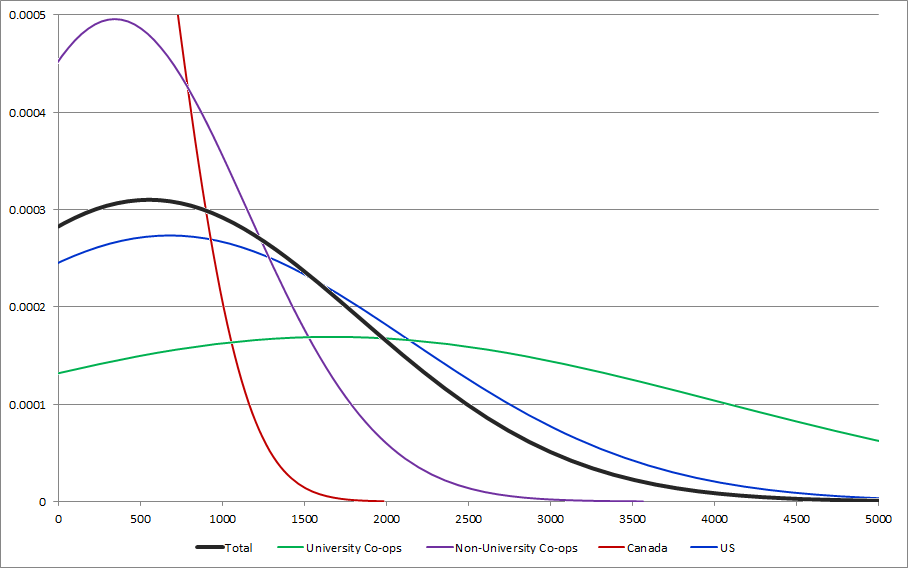
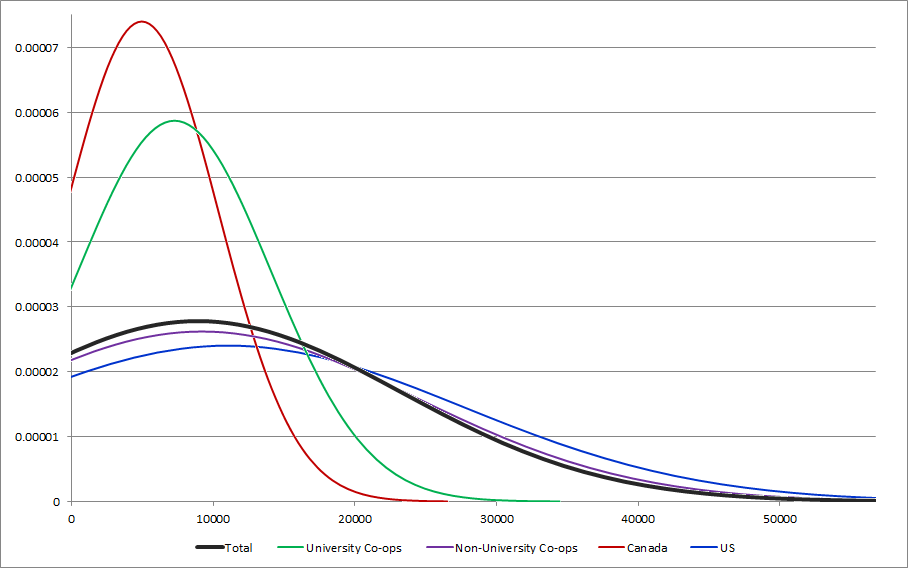
How many individuals used your shop services in 2010?
|
|
Total
|
University Co-ops
|
Non-University Co-ops
|
Canada
|
US
|
| Count
|
46
|
12
|
34
|
15
|
30
|
| Sum
|
55937
|
11415
|
44522
|
14195
|
41462
|
| Standard deviation
|
1726.57
|
1073.85
|
1895.45
|
862.23
|
2026.35
|
| Average
|
1216.02
|
951.25
|
1309.47
|
946.33
|
1382.07
|
| Minimum
|
30
|
70
|
30
|
30
|
40
|
| 1st quartile
|
272.5
|
225
|
272.5
|
400
|
250
|
| 2nd quartile
|
500
|
500
|
500
|
500
|
500
|
| 3rd quartile
|
2000
|
1000
|
2000
|
2000
|
2000
|
| Maximum
|
10000
|
3500
|
10000
|
3000
|
10000
|
| Totals
|
|
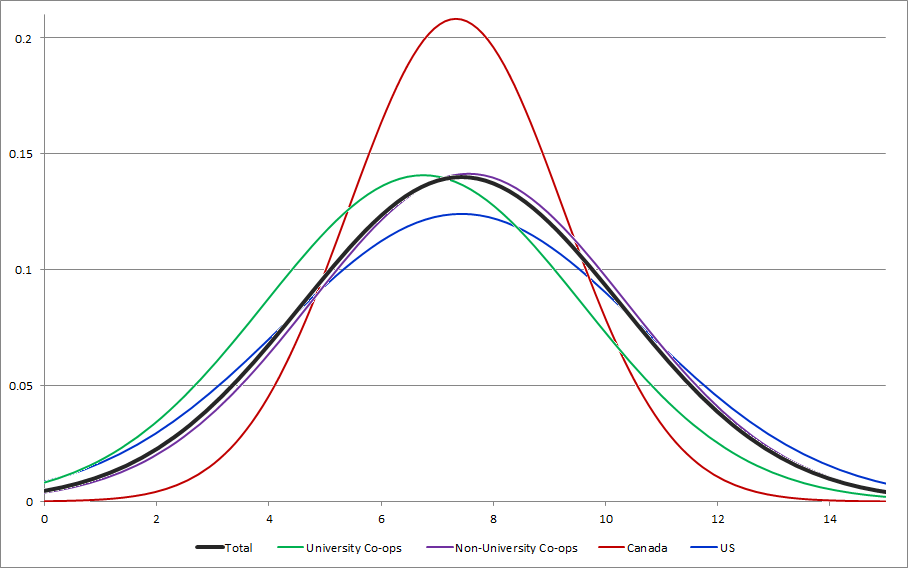
How many users can your space support at one time?
|
|
Total
|
University Co-ops
|
Non-University Co-ops
|
Canada
|
US
|
| 0
|
0
|
0
|
0
|
0
|
0
|
| 1
|
0
|
0
|
0
|
0
|
0
|
| 2
|
1
|
0
|
1
|
0
|
1
|
| 3
|
0
|
0
|
0
|
0
|
0
|
| 4
|
4
|
2
|
2
|
0
|
4
|
| 5
|
6
|
2
|
4
|
2
|
3
|
| 6
|
11
|
4
|
7
|
4
|
7
|
| 7
|
3
|
1
|
2
|
3
|
0
|
| 8
|
8
|
1
|
7
|
3
|
5
|
| 9
|
1
|
0
|
1
|
1
|
0
|
| 10
|
6
|
1
|
5
|
1
|
5
|
| 11
|
0
|
0
|
0
|
0
|
0
|
| 12
|
3
|
0
|
3
|
1
|
2
|
| 13
|
0
|
0
|
0
|
0
|
0
|
| 14
|
1
|
1
|
0
|
0
|
1
|
| 15
|
1
|
0
|
1
|
0
|
1
|
| 16
|
0
|
0
|
0
|
0
|
0
|
| Totals
|
|
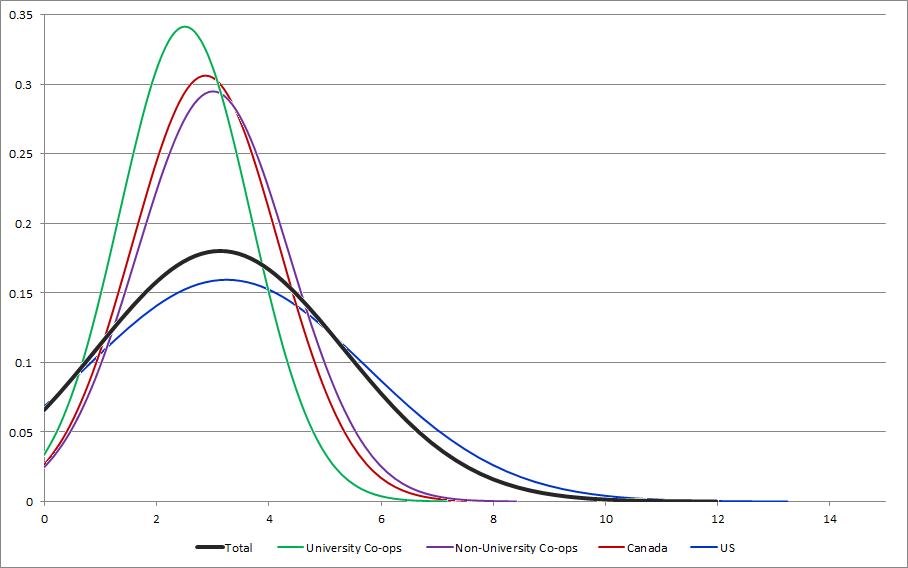
How many volunteers do you normally have in the shop at any given time?
|
|
Total
|
University Co-ops
|
Non-University Co-ops
|
Canada
|
US
|
| 0
|
1
|
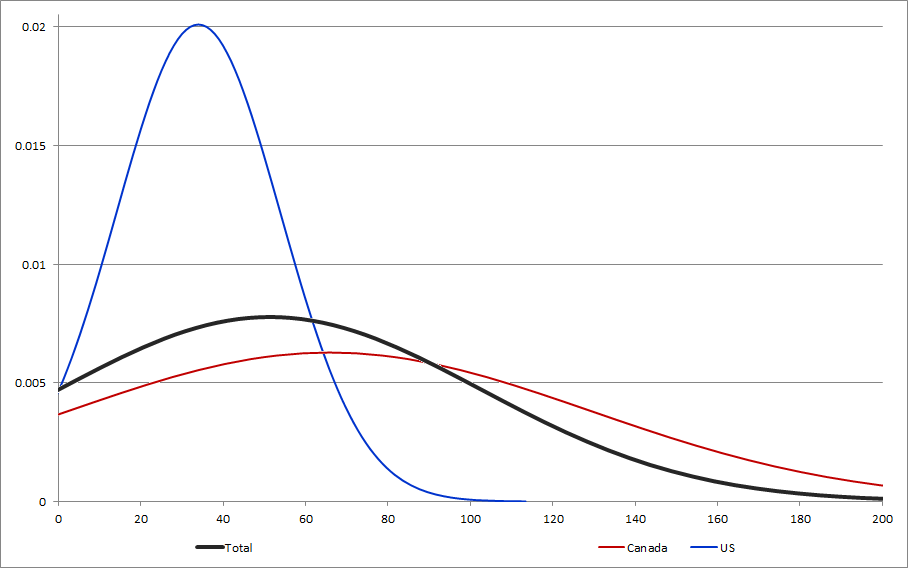
0
|
1
|
0
|
1
|
| 1
|
5
|
2
|
3
|
1
|
4
|
| 2
|
13
|
5
|
8
|
7
|
6
|
| 3
|
15
|
3
|
12
|
3
|
11
|
| 4
|
6
|
1
|
5
|
1
|
5
|
| 5
|
4
|
1
|
3
|
3
|
1
|
| 6
|
2
|
0
|
2
|
0
|
2
|
| Other
|
1
|
0
|
1
|
0
|
1
|
| Totals
|
|
How many months of 2010 was your shop open?
|
|
Total
|
University Co-ops
|
Non-University Co-ops
|
Canada
|
US
|
| 4
|
1
|
0
|
1
|
0
|
1
|
| 6
|
1
|
0
|
1
|
0
|
0
|
| 7
|
3
|
1
|
2
|
1
|
2
|
| 8
|
3
|
0
|
3
|
1
|
2
|
| 9
|
3
|
0
|
3
|
0
|
3
|
| 10
|
2
|
1
|
1
|
0
|
2
|
| 11
|
3
|
3
|
0
|
1
|
2
|
| 12
|
30
|
7
|
23
|
12
|
18
|
| Totals
|
|
On average, how many hours a week was your shop open for use?
Winter
|
|
Total
|
University Co-ops
|
Non-University Co-ops
|
Canada
|
US
|
| Count
|
45
|
11
|
34
|
14
|
30
|
| Sum
|
756
|
217
|
539
|
320
|
428
|
| Standard deviation
|
14.27
|
9.58
|
15.36
|
11.92
|
14.59
|
| Average
|
16.8
|
19.73
|
15.85
|
22.86
|
14.27
|
| 1st quartile
|
5.75
|
10
|
4.25
|
12.75
|
2
|
| Median value
|
14
|
15
|
12.5
|
20.5
|
11.5
|
| 3rd quartile
|
24.5
|
30
|
21
|
30
|
21
|
| Maximum
|
55
|
30
|
55
|
55
|
55
|
| Totals
|
|
Summer
|
|
Total
|
University Co-ops
|
Non-University Co-ops
|
Canada
|
US
|
| Count
|
45
|
11
|
34
|
14
|
30
|
| Sum
|
952.5
|
247
|
705.5
|
357
|
595.5
|
| Standard deviation
|
18.62
|
11.9
|
20.3
|
13.7
|
20.17
|
| Average
|
21.17
|
22.45
|
20.75
|
25.5
|
19.85
|
| 1st quartile
|
8
|
8
|
8
|
12
|
6.75
|
| Median value
|
15
|
24
|
14.5
|
28
|
14.5
|
| 3rd quartile
|
30
|
30
|
25
|
31.25
|
24
|
| Maximum
|
90
|
38
|
90
|
62
|
90
|
| Totals
|
|
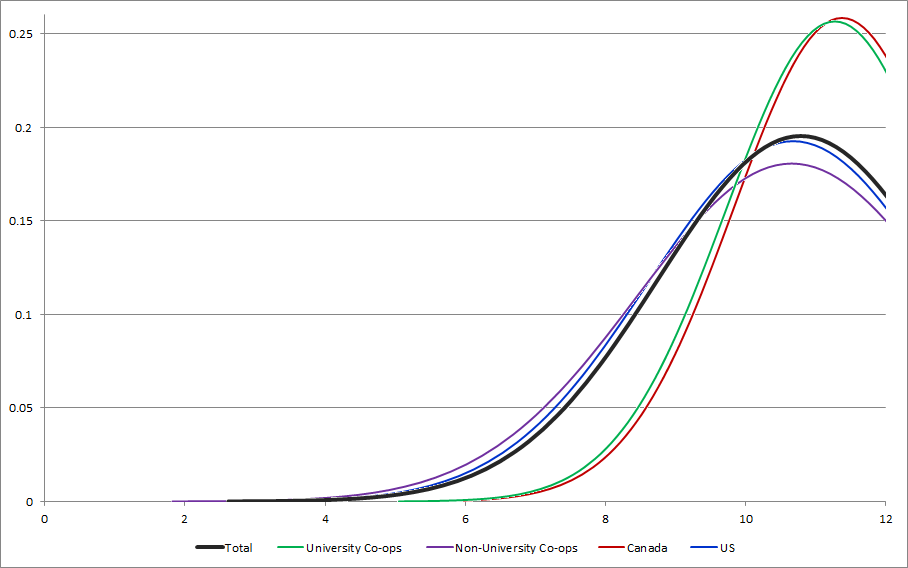
How many days a week is your shop open on average?
|
|
Total
|
University Co-ops
|
Non-University Co-ops
|
Canada
|
US
|
| 2
|
4
|
1
|
3
|
0
|
4
|
| 3
|
6
|
0
|
6
|
0
|
5
|
| 4
|
9
|
2
|
7
|
3
|
6
|
| 5
|
8
|
1
|
7
|
2
|
6
|
| 6
|
13
|
6
|
7
|
7
|
6
|
| 7
|
3
|
1
|
2
|
1
|
2
|
| 8
|
2
|
0
|
2
|
1
|
1
|
| Totals
|
|
Other than membership (if applicable) how much does it cost to use your shop?
Please note: the data shown here is limited only to costs per hour.
|
|
Total
|
University Co-ops
|
Non-University Co-ops
|
Canada
|
US
|
| Count
|
11
|
1
|
10
|
3
|
8
|
| Sum
|
55
|
5
|
50
|
12
|
3
|
| Standard deviation
|
1.86
|
-
|
1.95
|
1.41
|
1.87
|
| Average
|
5
|
5
|
5
|
4
|
5.38
|
| Minimum
|
2
|
5
|
2
|
2
|
3
|
| 1st quartile (Q1)
|
5
|
4.5
|
5
|
2
|
5
|
| Median value
|
5
|
5
|
5
|
2
|
5
|
| 3rd quartile (Q3)
|
5
|
5
|
5
|
5
|
5
|
| Maximum
|
10
|
5
|
10
|
5
|
10
|
| Totals
|
|
We charge per...
|
|
Total
|
University Co-ops
|
Non-University Co-ops
|
Canada
|
US
|
| Hour
|
11
|
1
|
10
|
3
|
8
|
| Day
|
1
|
0
|
1
|
0
|
1
|
| Visit
|
4
|
1
|
3
|
2
|
2
|
| Other
|
1
|
1
|
0
|
0
|
1
|
| No Cost
|
28
|
9
|
19
|
9
|
18
|
Bicycle Sharing
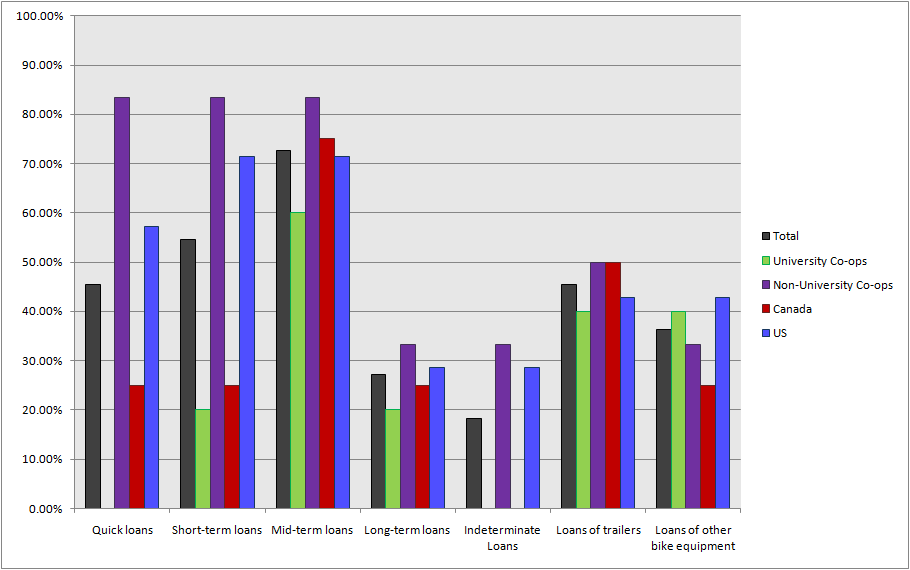
What types of bike sharing do you offer?
|
|
Total
|
University Co-ops
|
Non-University Co-ops
|
Canada
|
US
|
| Quick loans
|
5
|
0
|
5
|
1
|
4
|
| Short-term loans
|
6
|
1
|
5
|
1
|
5
|
| Mid-term loans
|
8
|
3
|
5
|
3
|
5
|
| Long-term loans
|
3
|
1
|
2
|
1
|
2
|
| Indeterminate Loans
|
2
|
0
|
2
|
0
|
2
|
| Loans of trailers
|
5
|
2
|
3
|
2
|
3
|
| Loans of other bike equipment
|
4
|
2
|
2
|
1
|
3
|
| Other
|
2
|
1
|
1
|
0
|
2
|
| Totals
|
|
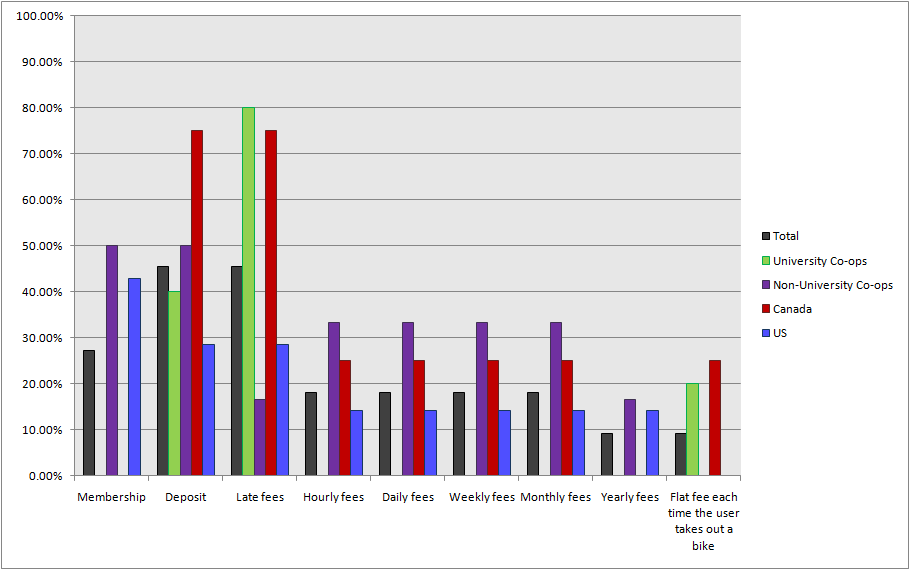
What costs to the user are associated with the system(s) that you use?
|
|
Total
|
University Co-ops
|
Non-University Co-ops
|
Canada
|
US
|
| Membership
|
3
|
0
|
3
|
0
|
3
|
| Deposit
|
5
|
2
|
3
|
3
|
2
|
| Late fees
|
5
|
4
|
1
|
3
|
2
|
| Hourly fees
|
2
|
0
|
2
|
1
|
1
|
| Daily fees
|
2
|
0
|
2
|
1
|
1
|
| Weekly fees
|
2
|
0
|
2
|
1
|
1
|
| Monthly fees
|
2
|
0
|
2
|
1
|
1
|
| Yearly fees
|
1
|
0
|
1
|
0
|
1
|
| Flat fee each time the user takes out a bike
|
1
|
1
|
0
|
1
|
0
|
| Totals
|
|
What sorts of bikes do you have for lending?
|
|
Total
|
University Co-ops
|
Non-University Co-ops
|
Canada
|
US
|
| New bikes subsidized or donated by a third party organization
|
1
|
0
|
1
|
0
|
1
|
| Used donations
|
10
|
4
|
6
|
4
|
6
|
| Other
|
2
|
1
|
1
|
1
|
1
|
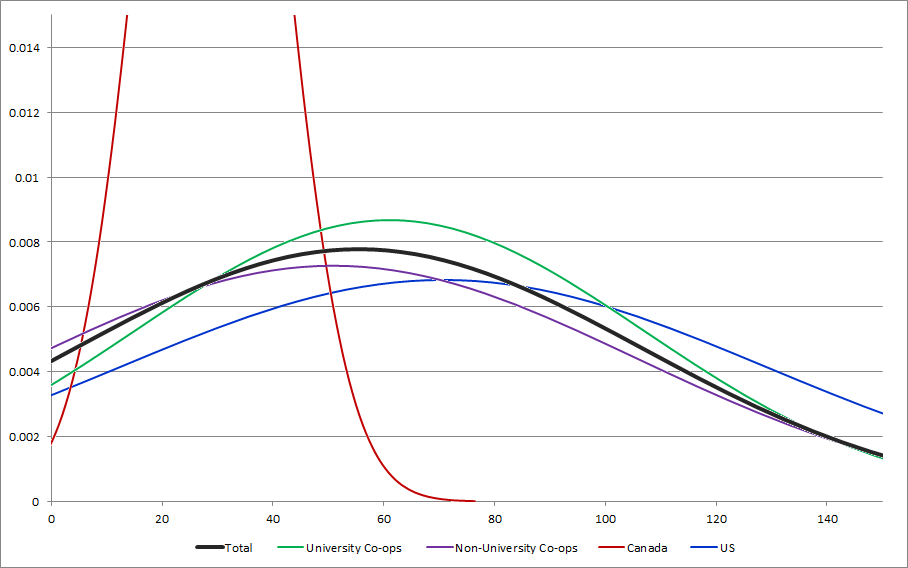
How many bikes are in your fleet?
|
|
Total
|
University Co-ops
|
Non-University Co-ops
|
Canada
|
US
|
| Count
|
11
|
5
|
6
|
4
|
7
|
| Sum
|
610
|
305
|
305
|
115
|
495
|
| Standard deviation
|
51.28
|
45.98
|
54.88
|
11.92
|
58.4
|
| Average
|
55.45
|
61
|
50.83
|
28.75
|
70.71
|
| 1st quartile
|
15
|
27.5
|
18.75
|
16.25
|
15
|
| Median value
|
25
|
35
|
20
|
27.5
|
25
|
| 3rd quartile
|
100
|
102.5
|
112.5
|
42.5
|
150
|
| Maximum
|
150
|
150
|
150
|
45
|
150
|
| Totals
|
|
University or College Collectives
What is the approximate total number of students that attend the institution?
|
|
Total
|
Canada
|
US
|
| 500 - 1 000
|
1
|
0
|
1
|
| 10 000 - 25 000
|
2
|
2
|
0
|
| 25 000 - 50 000
|
8
|
4
|
4
|
Approximately how many staff are employed at the university (if you are able to obtain this)?
|
|
Total
|
Canada
|
US
|
| Count
|
6
|
3
|
3
|
| Sum
|
29507
|
10107
|
19400
|
| Standard deviation
|
4165.11
|
1209.54
|
5332.5
|
| Average
|
4917.83
|
3369
|
6466.67
|
| Minimum
|
2107
|
2107
|
2400
|
| 1st quartile
|
2326.75
|
2107
|
2400
|
| 2nd quartile
|
3000
|
2107
|
2400
|
| 3rd quartile
|
7250
|
5000
|
14000
|
| Maximum
|
14000
|
5000
|
14000
|
How is your organization or collective officially associated with this institution?
|
|
Total
|
Canada
|
US
|
| part of the university itself
|
4
|
1
|
3
|
| part of the students' union
|
4
|
4
|
0
|
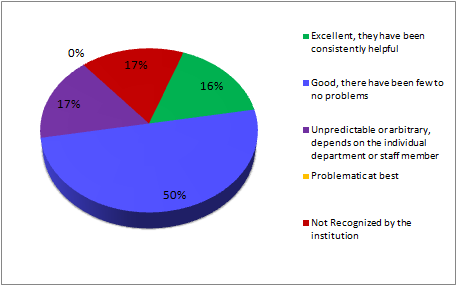
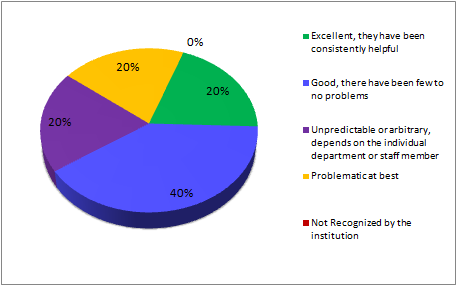
Which would best describe your relationship with the institution?
|
|
Total
|
Canada
|
US
|
| Excellent, they have been consistently helpful
|
2
|
1
|
1
|
| Good, there have been few to no problems
|
5
|
3
|
2
|
| Unpredictable or arbitrary, depends on the individual department or staff member
|
2
|
1
|
1
|
| Problematic at best
|
1
|
0
|
1
|
| Not Recognized by the institution
|
1
|
1
|
0
|
| Totals
|

|
| Canada
|
US
|
|
|
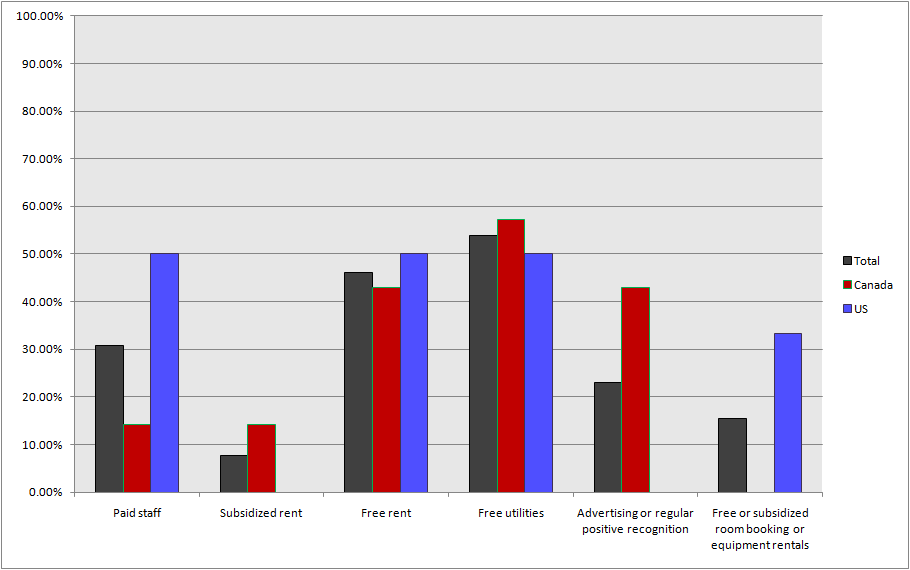
How does the institution support you?
|
|
Total
|
Canada
|
US
|
| Paid staff
|
4
|
1
|
3
|
| Subsidized rent
|
1
|
1
|
0
|
| Free rent
|
6
|
3
|
3
|
| Free utilities
|
7
|
4
|
3
|
| Advertising or regular positive recognition
|
3
|
3
|
0
|
| Free or subsidized room booking or equipment rentals
|
2
|
0
|
2
|
| Other
|
1
|
0
|
1
|
| Totals
|
|
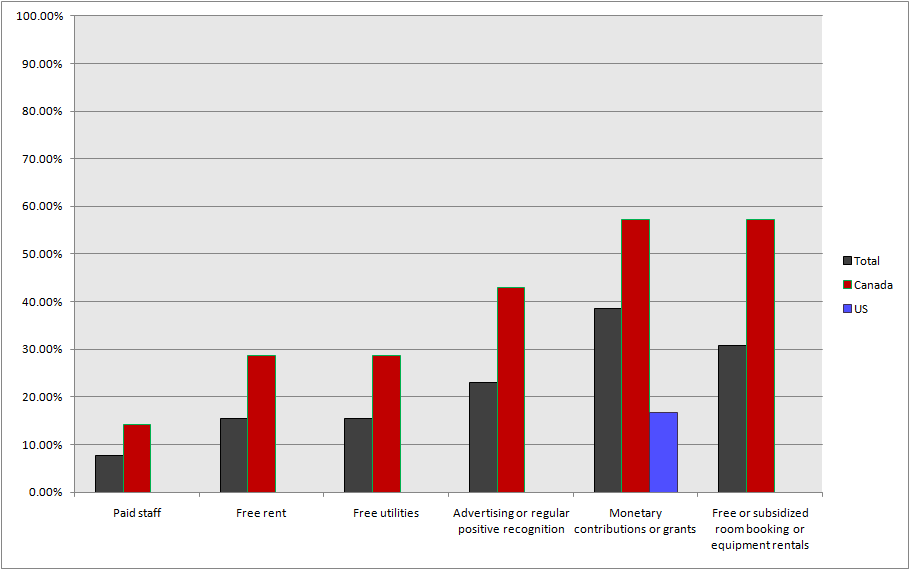
How does the students' union support your organization or collective?
|
|
Total
|
Canada
|
US
|
| Paid staff
|
1
|
1
|
0
|
| Free rent
|
2
|
2
|
0
|
| Free utilities
|
2
|
2
|
0
|
| Advertising or regular positive recognition
|
3
|
3
|
0
|
| Monetary contributions or grants
|
5
|
4
|
1
|
| Free or subsidized room booking or equipment rentals
|
4
|
4
|
0
|
| Other
|
1
|
1
|
0
|
| Totals
|
|
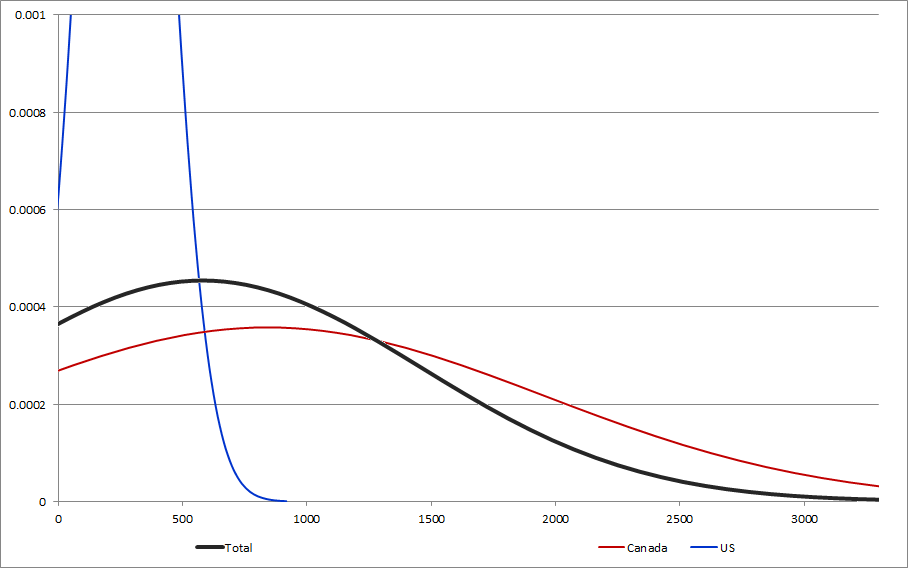
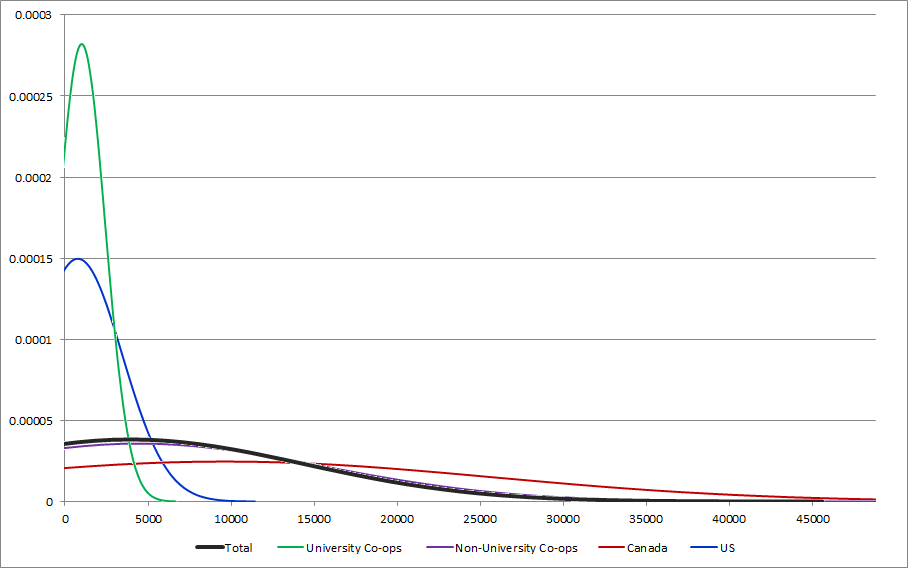
Approximately how many individual students did you serve in 2010?
|
|
Total
|
Canada
|
US
|
| Count
|
11
|
6
|
5
|
| Sum
|
6385
|
5045
|
1340
|
| Standard deviation
|
878.11
|
1114.71
|
162.16
|
| Average
|
580.45
|
840.83
|
268
|
| Minimum
|
75
|
75
|
90
|
| 1st quartile
|
100
|
168.75
|
95
|
| Median value
|
250
|
410
|
100
|
| 3rd quartile
|
500
|
1312.5
|
450
|
| Maximum
|
3300
|
3300
|
500
|
| Totals
|
|
Approximately how many faculty and staff members did you serve?
|
|
Total
|
Canada
|
US
|
| Count
|
11
|
6
|
5
|
| Sum
|
565
|
395
|
170
|
| Standard deviation
|
51.31
|
63.54
|
19.85
|
| Average
|
51.36
|
65.83
|
34
|
| Minimum
|
5
|
10
|
5
|
| 1st quartile
|
15
|
17.5
|
10
|
| Median value
|
40
|
45
|
15
|
| 3rd quartile
|
50
|
106.25
|
50
|
| Maximum
|
200
|
200
|
50
|
| Totals
|
|
How many individual students volunteered with your organization or collective?
|
|
Total
|
Canada
|
US
|
| Count
|
11
|
6
|
5
|
| Sum
|
208
|
138
|
70
|
| Standard deviation
|
8.21
|
8.66
|
3.74
|
| Average
|
18.91
|
23
|
14
|
| Minimum
|
10
|
15
|
10
|
| 1st quartile
|
15
|
15
|
10
|
| Median value
|
15
|
19
|
10
|
| 3rd quartile
|
20
|
35
|
17.5
|
| Maximum
|
35
|
35
|
20
|
| Totals
|
|
How many faculty or staff members volunteered with your organization or collective?
|
|
Total
|
Canada
|
US
|
| Count
|
11
|
6
|
5
|
| Sum
|
19
|
9
|
10
|
| Standard deviation
|
1.81
|
1.71
|
1.9
|
| Average
|
1.73
|
1.5
|
2
|
| Median value
|
1
|
1
|
0
|
| 3rd quartile
|
3
|
2.75
|
4
|
| Maximum
|
5
|
5
|
5
|
| Totals
|
|
Who is allowed to use your services?
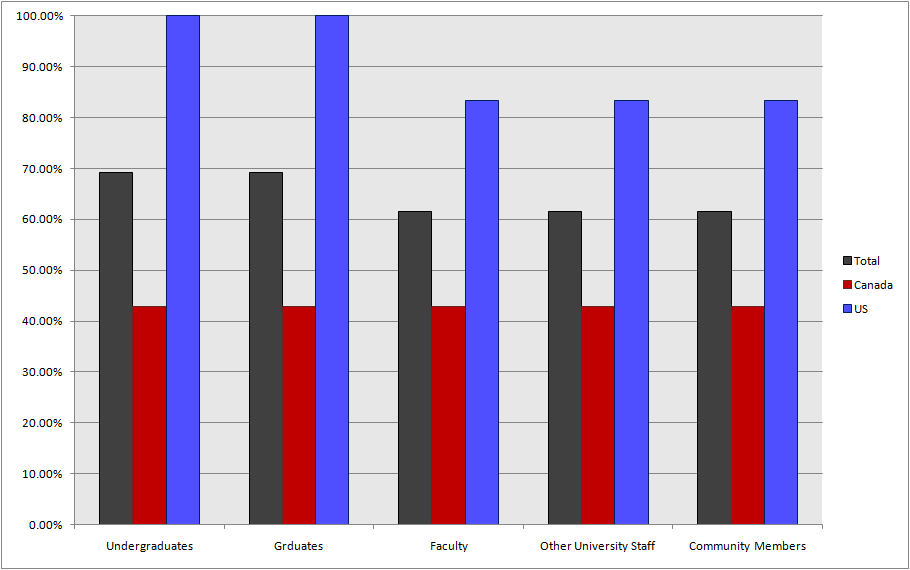
Undergraduates
|
|
Total
|
Canada
|
US
|
| YES
|
9
|
3
|
6
|
| Not Applicable
|
3
|
1
|
2
|
Graduates
|
|
Total
|
Canada
|
US
|
| YES
|
9
|
3
|
6
|
| Not Applicable
|
3
|
1
|
2
|
Faculty
|
|
Total
|
Canada
|
US
|
| YES
|
8
|
3
|
5
|
| We choose not to
|
1
|
0
|
1
|
| Not Applicable
|
3
|
1
|
2
|
Other University Staff
|
|
Total
|
Canada
|
US
|
| YES
|
8
|
3
|
5
|
| We choose not to
|
1
|
0
|
1
|
| Not Applicable
|
3
|
1
|
2
|
|
|
Total
|
Canada
|
US
|
| YES
|
8
|
3
|
5
|
| We choose not to
|
2
|
0
|
2
|
| Not Applicable
|
2
|
1
|
1
|
| Totals
|
|
Costs and Income
How much did it cost to run your organization or co-operative in 2010?
Rent
|
|
Total
|
University Co-ops
|
Non-University Co-ops
|
Canada
|
US
|
| Count
|
36
|
8
|
28
|
11
|
24
|
| Sum
|
195765.51
|
54337
|
141428.51
|
61351
|
134013
|
| Standard deviation
|
8128.2
|
13167.81
|
5893.23
|
7039.86
|
8677.53
|
| Average
|
5437.93
|
6792.13
|
5051.02
|
5577.36
|
5583.88
|
| 2nd quartile
|
1700
|
0
|
2825
|
600
|
1700
|
| 3rd quartile
|
8000
|
11502.25
|
8000
|
12600
|
8000
|
| Maximum
|
39000
|
39000
|
22000
|
22000
|
39000
|
| Totals
|
|
Utilities
|
|
Total
|
University Co-ops
|
Non-University Co-ops
|
Canada
|
US
|
| Count
|
30
|
7
|
23
|
10
|
19
|
| Sum
|
23190
|
3000
|
20190
|
9100
|
14090
|
| Standard deviation
|
1334.18
|
1049.78
|
1392.59
|
1338.99
|
1350.8
|
| Average
|
773
|
428.57
|
877.83
|
910
|
741.58
|
| 2nd quartile
|
2.5
|
0
|
15
|
0
|
5
|
| 3rd quartile
|
700
|
0
|
1000
|
2250
|
600
|
| Maximum
|
5000
|
3000
|
5000
|
3600
|
5000
|
| Totals
|
|
Wages and honorariums
|
|
Total
|
University Co-ops
|
Non-University Co-ops
|
Canada
|
US
|
| Count
|
34
|
8
|
26
|
12
|
21
|
| Sum
|
530630
|
194030
|
336600
|
256530
|
274100
|
| Standard deviation
|
23625.12
|
32552.22
|
19332.7
|
22410.73
|
24073.17
|
| Average
|
15606.76
|
24253.75
|
12946.15
|
21377.5
|
13052.38
|
| 2nd quartile
|
3000
|
8015
|
100
|
15265
|
0
|
| 3rd quartile
|
25500
|
42750
|
21250
|
42750
|
14650
|
| Maximum
|
100000
|
100000
|
66300
|
66300
|
100000
|
| Totals
|
|
Repair supplies
|
|
Total
|
University Co-ops
|
Non-University Co-ops
|
Canada
|
US
|
| Count
|
33
|
8
|
25
|
12
|
20
|
| Sum
|
130032.26
|
63313
|
66719.26
|
42113
|
86375
|
| Standard deviation
|
7228.9
|
12755.13
|
3201.16
|
3408.59
|
8871.94
|
| Average
|
3940.37
|
7914.13
|
2668.77
|
3509.42
|
4318.75
|
| Minimum
|
10
|
200
|
10
|
300
|
10
|
| 1st quartile
|
400
|
550
|
300
|
550
|
200
|
| Median value
|
1500
|
956.5
|
1500
|
2200
|
1250
|
| 3rd quartile
|
5000
|
10000
|
4500
|
5600
|
4500
|
| Maximum
|
40000
|
40000
|
15000
|
10000
|
40000
|
| Totals
|
|
Stationary
|
|
Total
|
University Co-ops
|
Non-University Co-ops
|
Canada
|
US
|
| Count
|
26
|
6
|
20
|
8
|
17
|
| Sum
|
13330
|
5310
|
8020
|
1380
|
11950
|
| Standard deviation
|
1190.45
|
1840.7
|
878.53
|
262.67
|
1424.38
|
| Average
|
512.69
|
885
|
401
|
172.5
|
702.94
|
| 2nd quartile
|
100
|
95
|
100
|
100
|
90
|
| 3rd quartile
|
300
|
1325
|
300
|
100
|
550
|
| Maximum
|
5000
|
5000
|
4000
|
860
|
5000
|
| Totals
|
|
Services (waste disposal, rag services, ect.)
|
|
Total
|
University Co-ops
|
Non-University Co-ops
|
Canada
|
US
|
| Count
|
26
|
7
|
19
|
7
|
18
|
| Sum
|
5010
|
1100
|
3910
|
1000
|
4010
|
| Standard deviation
|
583.34
|
249.9
|
664.84
|
206.03
|
686.36
|
| Average
|
192.69
|
157.14
|
205.79
|
142.86
|
222.78
|
| 3rd quartile
|
185
|
500
|
180
|
200
|
60
|
| Maximum
|
3000
|
600
|
3000
|
600
|
3000
|
| Totals
|
|
Vehicle or On-Site Repairs
|
|
Total
|
University Co-ops
|
Non-University Co-ops
|
Canada
|
US
|
| Count
|
22
|
6
|
16
|
5
|
16
|
| Sum
|
10860
|
260
|
10600
|
0
|
10860
|
| Standard deviation
|
2076.65
|
63.68
|
2413.21
|
0
|
2409.15
|
| Average
|
493.64
|
43.33
|
662.5
|
0
|
678.75
|
| 3rd quartile
|
175
|
115
|
0
|
0
|
145
|
| Maximum
|
10000
|
160
|
10000
|
0
|
10000
|
| Totals
|
|
Taxes
|
|
Total
|
University Co-ops
|
Non-University Co-ops
|
Canada
|
US
|
| Count
|
20
|
5
|
15
|
5
|
14
|
| Sum
|
13680
|
1500
|
12180
|
500
|
13180
|
| Standard deviation
|
2175.65
|
600
|
2475.03
|
200
|
2554.66
|
| Average
|
684
|
300
|
812
|
100
|
941.43
|
| 3rd quartile
|
625
|
2250
|
500
|
750
|
720
|
| Maximum
|
10000
|
1500
|
10000
|
500
|
10000
|
| Totals
|
|
|
Insurance
|
|
Total
|
University Co-ops
|
Non-University Co-ops
|
Canada
|
US
|
| Count
|
26
|
5
|
21
|
7
|
18
|
| Sum
|
26610
|
6300
|
20310
|
7300
|
19310
|
| Standard deviation
|
1337.98
|
1936.59
|
1143.23
|
1166.02
|
1412.91
|
| Average
|
1023.46
|
1260
|
967.14
|
1042.86
|
1072.78
|
| 2nd quartile
|
550
|
0
|
500
|
0
|
590
|
| 3rd quartile
|
1425
|
3150
|
1400
|
2200
|
1200
|
| Maximum
|
5000
|
5000
|
3906
|
3200
|
5000
|
| Totals
|
|
Operating Costs - Other / Combined
|
|
Total
|
University Co-ops
|
Non-University Co-ops
|
Canada
|
US
|
| Count
|
22
|
5
|
17
|
10
|
11
|
| Sum
|
220228.66
|
12902
|
207326.66
|
155236
|
64900
|
| Standard deviation
|
21239.6
|
2719.59
|
23677.33
|
25379.11
|
16224.28
|
| Average
|
10010.39
|
2580.4
|
12195.69
|
15523.6
|
5900
|
| 2nd quartile
|
642
|
500
|
400
|
3476
|
0
|
| 3rd quartile
|
5851.5
|
5901
|
14000
|
25250
|
2000
|
| Maximum
|
85000
|
6000
|
85000
|
85000
|
57000
|
| Totals
|
|
Capital - Shop Equipment
|
|
Total
|
University Co-ops
|
Non-University Co-ops
|
Canada
|
US
|
| Count
|
24
|
7
|
17
|
9
|
14
|
| Sum
|
36663.53
|
13425
|
23238.53
|
17721
|
15854
|
| Standard deviation
|
1663.45
|
1430.29
|
1724.99
|
1656.63
|
1588.66
|
| Average
|
1527.65
|
1917.86
|
1366.97
|
1969
|
1132.43
|
| 1st quartile
|
325
|
500
|
75
|
500
|
0
|
| 2nd quartile
|
650
|
800
|
500
|
800
|
500
|
| 3rd quartile
|
3100.1325
|
3500
|
2544.265
|
3750
|
1526
|
| Maximum
|
5000
|
4000
|
5000
|
5000
|
5000
|
| Totals
|
|
Capital - Other /Combined
|
|
Total
|
University Co-ops
|
Non-University Co-ops
|
Canada
|
US
|
| Count
|
13
|
4
|
9
|
4
|
8
|
| Sum
|
4970
|
4320
|
650
|
3100
|
1870
|
| Standard deviation
|
836.88
|
1232.56
|
154.76
|
1285.25
|
441.27
|
| Average
|
382.31
|
1080
|
72.22
|
775
|
233.75
|
| 3rd quartile
|
300
|
2580
|
75
|
2275
|
387.5
|
| Maximum
|
3000
|
3000
|
500
|
3000
|
1320
|
| Totals
|
|
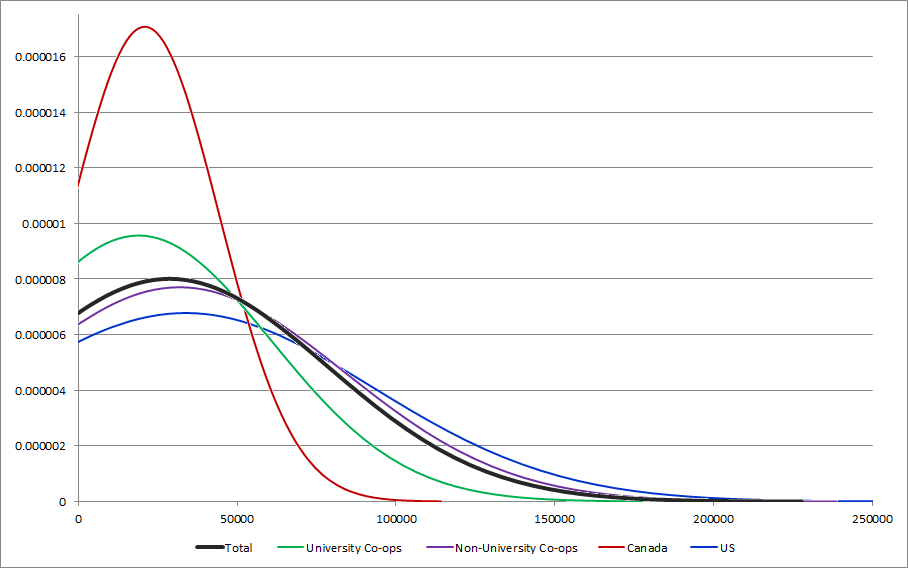
What was your organization's total income from sales and services for 2010?
|
|
Total
|
University Co-ops
|
Non-University Co-ops
|
Canada
|
US
|
| Count
|
37
|
9
|
28
|
12
|
24
|
| Sum
|
1060471.48
|
170091
|
890380.48
|
250083.57
|
809967
|
| Standard deviation
|
49803.6
|
41696.68
|
51752.77
|
23360.18
|
58833.7
|
| Average
|
28661.39
|
18899
|
31799.3
|
20840.3
|
33748.63
|
| 1st quartile
|
460.455
|
300
|
690.6825
|
1500
|
125
|
| Median value
|
10000
|
838
|
12500
|
11000
|
11500
|
| 3rd quartile
|
35185.945
|
12500
|
40000
|
37592.9725
|
35553.5
|
| Maximum
|
250000
|
136000
|
250000
|
68613.68
|
250000
|
| Totals
|
|
How much did you receive in grants or donations from any of the following?
State or Provincial Government
|
|
Total
|
University Co-ops
|
Non-University Co-ops
|
Canada
|
US
|
| Count
|
21
|
3
|
18
|
7
|
13
|
| Sum
|
82704.92
|
3000
|
79704.92
|
67300
|
10000
|
| Standard deviation
|
10420.18
|
1414.21
|
11165.34
|
16167.2
|
2664.69
|
| Average
|
3938.33
|
1000
|
4428.05
|
9614.29
|
769.23
|
| 3rd quartile
|
4250
|
3000
|
5101.23
|
7000
|
0
|
| Maximum
|
48800
|
3000
|
48800
|
48800
|
10000
|
| Totals
|
|
|
Municipal Government
| Count
|
19
|
3
|
16
|
4
|
14
|
| Sum
|
10500
|
5000
|
5500
|
1000
|
9500
|
| Standard deviation
|
1286.52
|
2357.02
|
804.65
|
433.01
|
1459.05
|
| Average
|
552.63
|
1666.67
|
343.75
|
250
|
678.57
|
| Maximum
|
5000
|
5000
|
3000
|
1000
|
5000
|
| Totals
|
|
Private Institutions
|
|
Total
|
University Co-ops
|
Non-University Co-ops
|
Canada
|
US
|
| Count
|
28
|
4
|
24
|
8
|
19
|
| Sum
|
249255
|
29000
|
220255
|
39505
|
209750
|
| Standard deviation
|
14342.48
|
6796.14
|
15223.76
|
5391.97
|
16599.7
|
| Average
|
8901.96
|
7250
|
9177.29
|
4938.13
|
11039.47
|
| 2nd quartile
|
1065
|
7000
|
1065
|
2252.5
|
400
|
| 3rd quartile
|
13750
|
14500
|
13000
|
11500
|
15000
|
| Maximum
|
56750
|
15000
|
56750
|
14000
|
56750
|
| Totals
|
|
Private Individuals
|
|
Total
|
University Co-ops
|
Non-University Co-ops
|
Canada
|
US
|
| Count
|
22
|
3
|
19
|
7
|
14
|
| Sum
|
311324.62
|
36353
|
274971.62
|
16966.85
|
294254
|
| Standard deviation
|
35831.35
|
12876.15
|
38205.63
|
2197.51
|
43417.79
|
| Average
|
14151.12
|
12117.67
|
14472.19
|
2423.84
|
21018.14
|
| 1st quartile
|
312.5
|
200
|
350
|
350
|
2300
|
| 2nd quartile
|
4150
|
200
|
3000
|
500
|
5425.5
|
| 3rd quartile
|
6125.8875
|
30000
|
6000
|
4600
|
15000
|
| Maximum
|
170000
|
30000
|
170000
|
6116.85
|
170000
|
| Totals
|

|


.png)


.png)
.png)


.png)
.png)
.png)
.png)


.png)
.png)
.png)
.png)


.png)
.png)
.png)
.png)

.png)
.png)
.png)
.png)


.png)
.png)


.png)
.png)


.png)
.png)
.png)
.png)
.png)
.png)
.png)
.png)
_(2).png)
.png)
.png)
.png)
.png)

.png)
_(2).png)
.png)
.png)
.png)